In this tutorial we are going to use SciQLop to create a catalog of events and use it to browse data.
Creating a catalog of events
“Events” are at the center of in situ measurement analysis. Their simplest form represents a couple of times (begin, end). The concept of event in SciQLop, however, is far richer as it can also contain lots of metadata that are very useful. The best definition of a catalog could simply be “a collection of events”.
After plotting data, here centered on a nice crossing of the Earth magnetopause by MMS, we start by opening the Catalogs tab, on the left side bar next to Products and Properties.
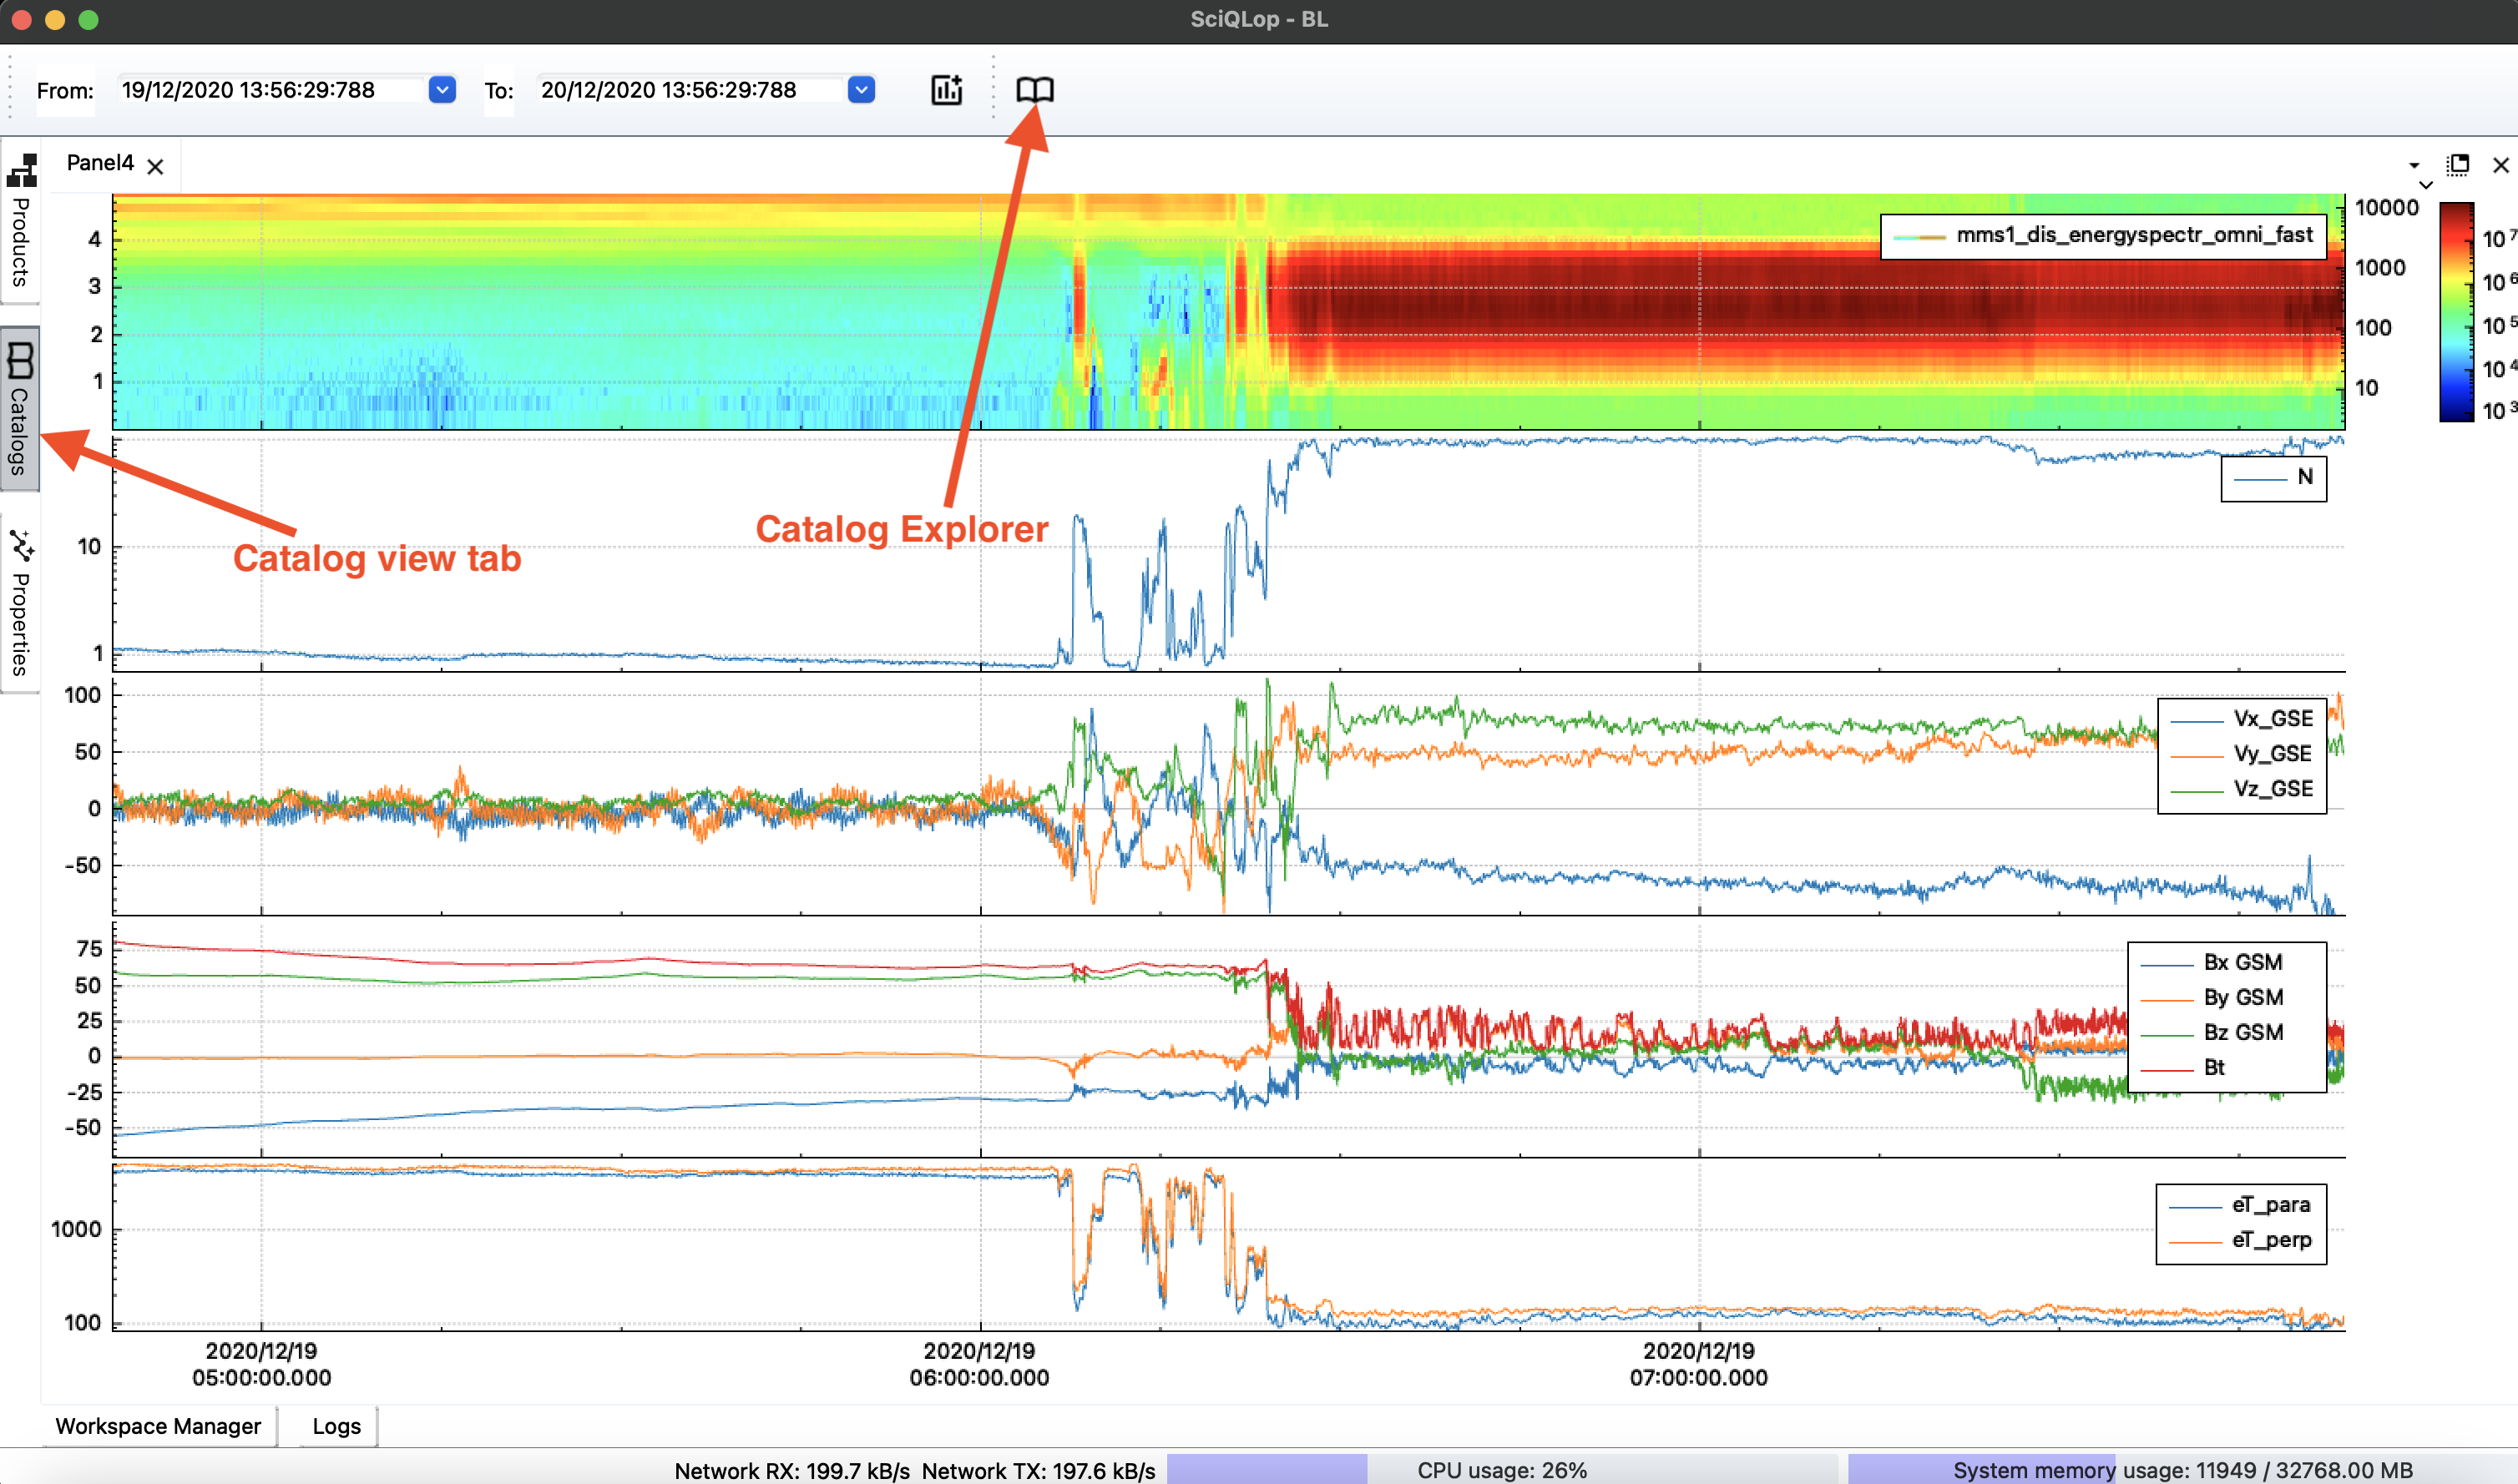
The catalog tab
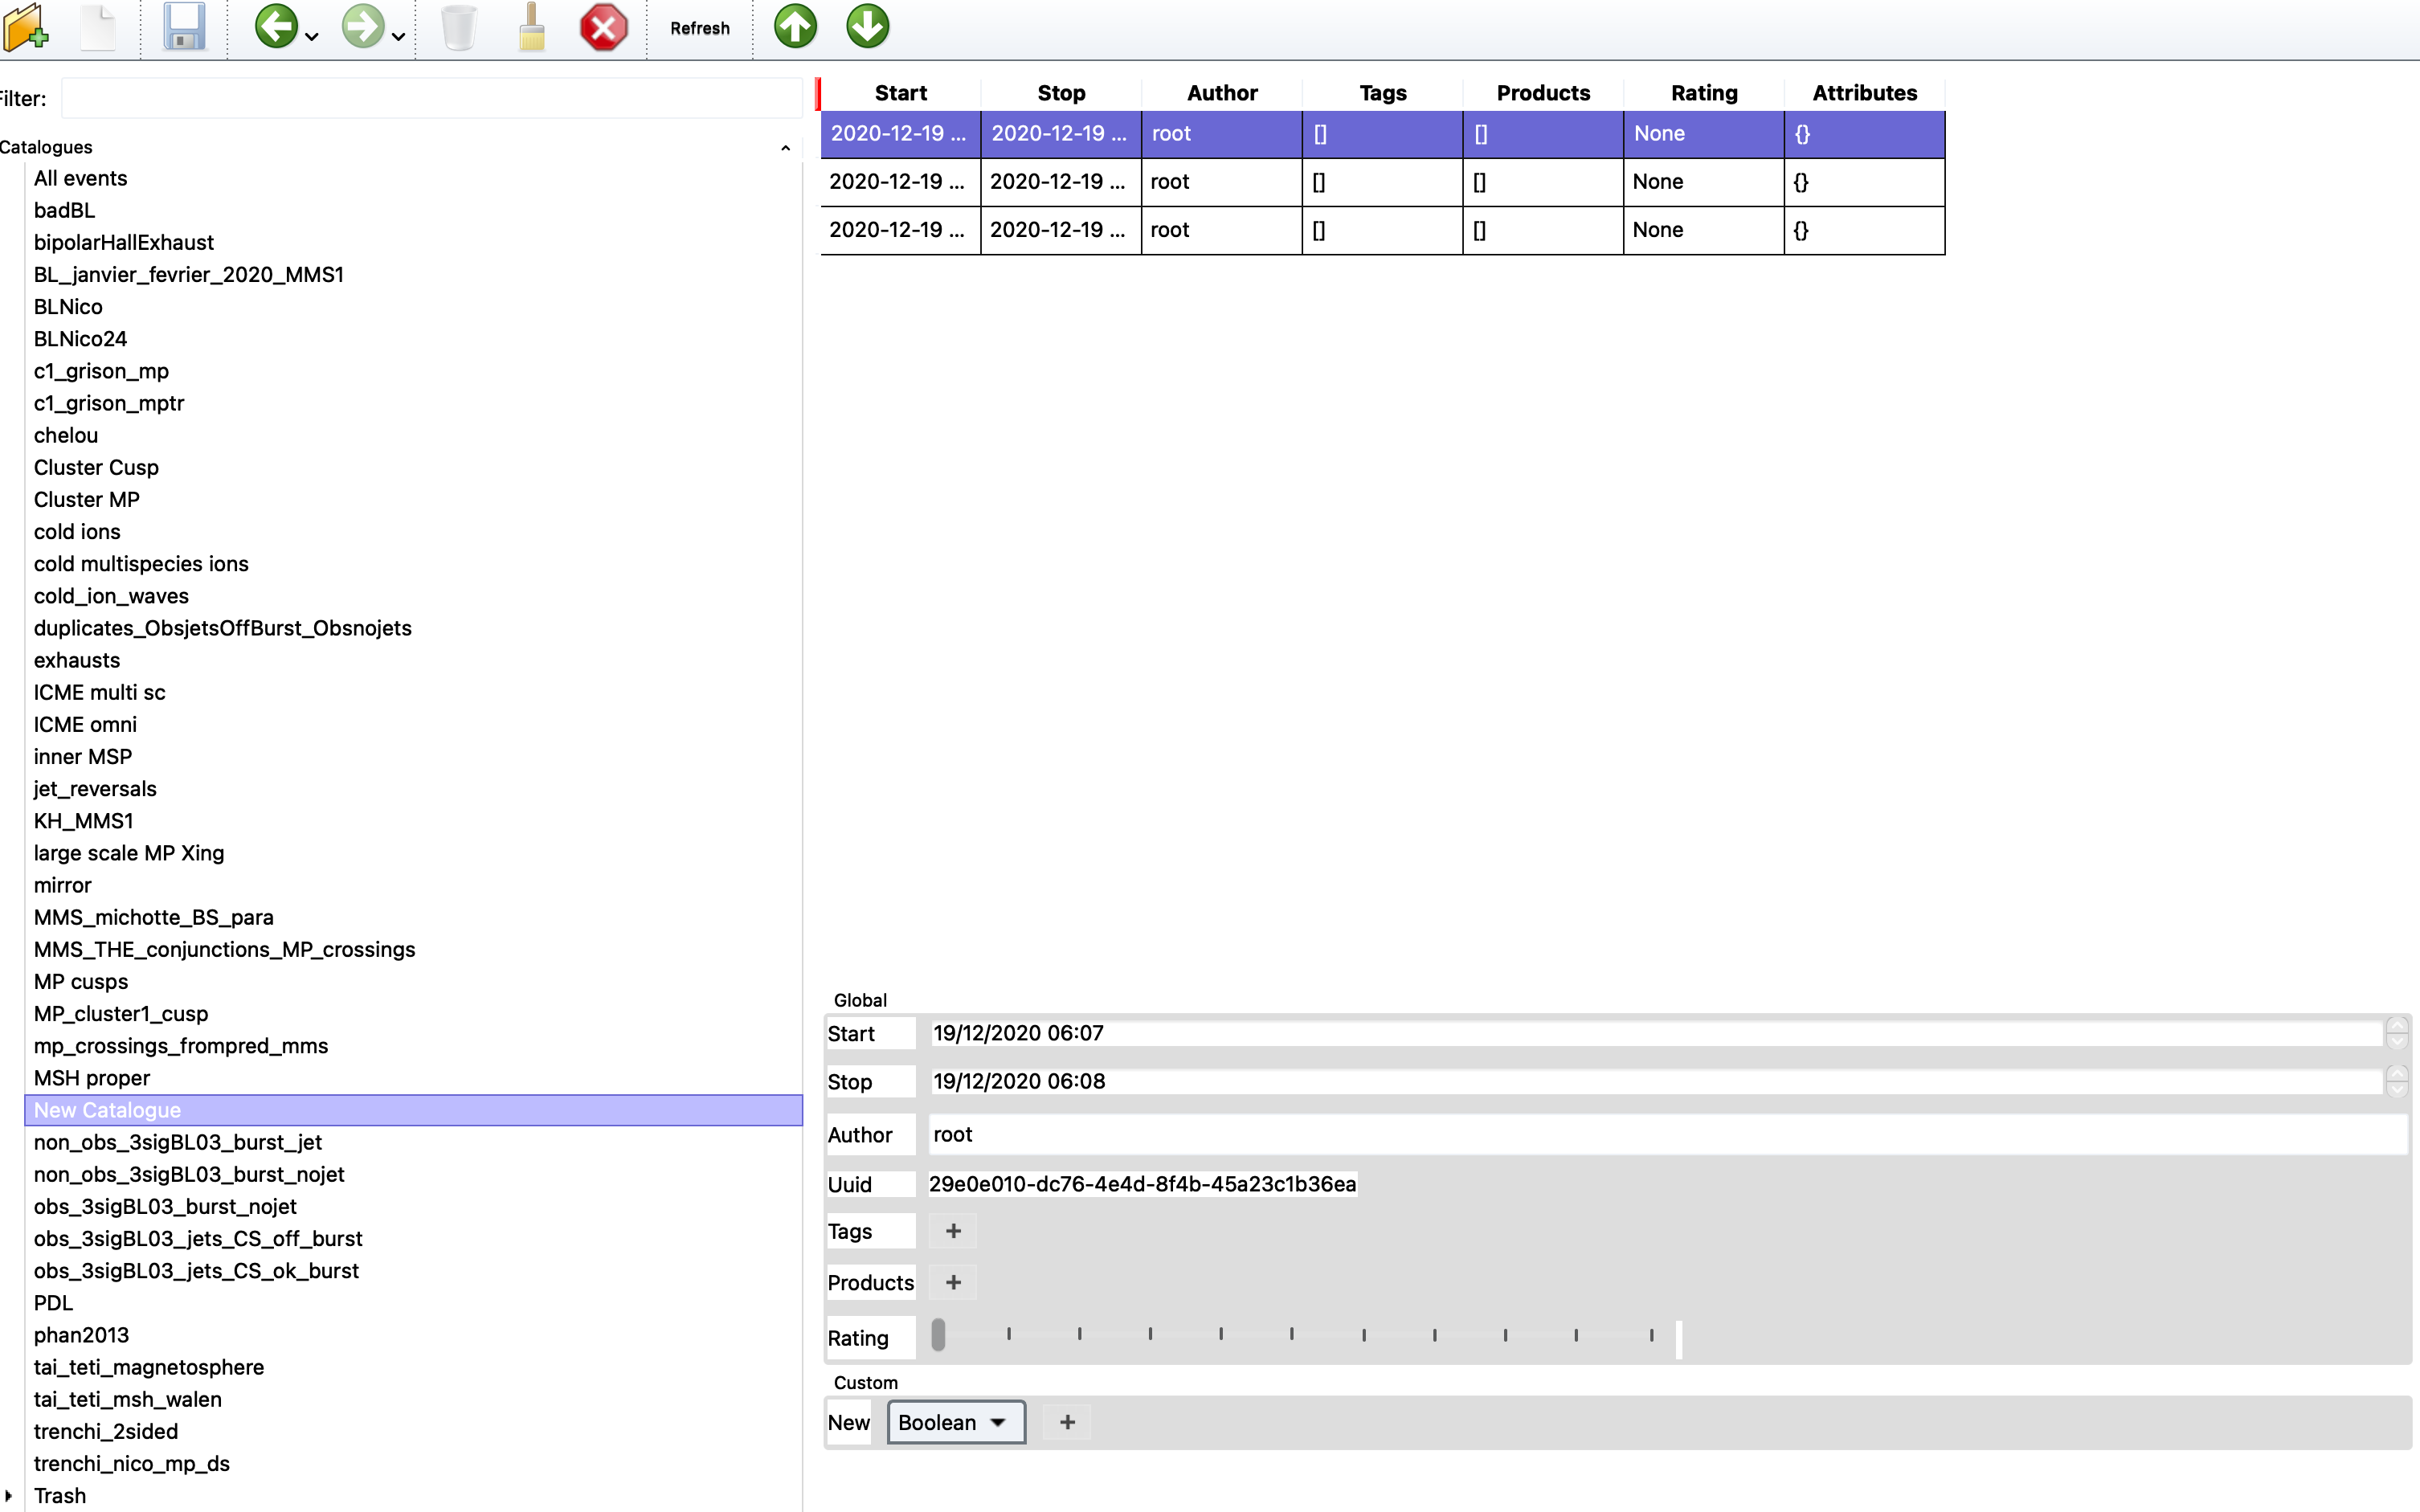
The Catalogs tab has two parts. On the left, a tree of catalogs. On the right, the events of the catalog you select.
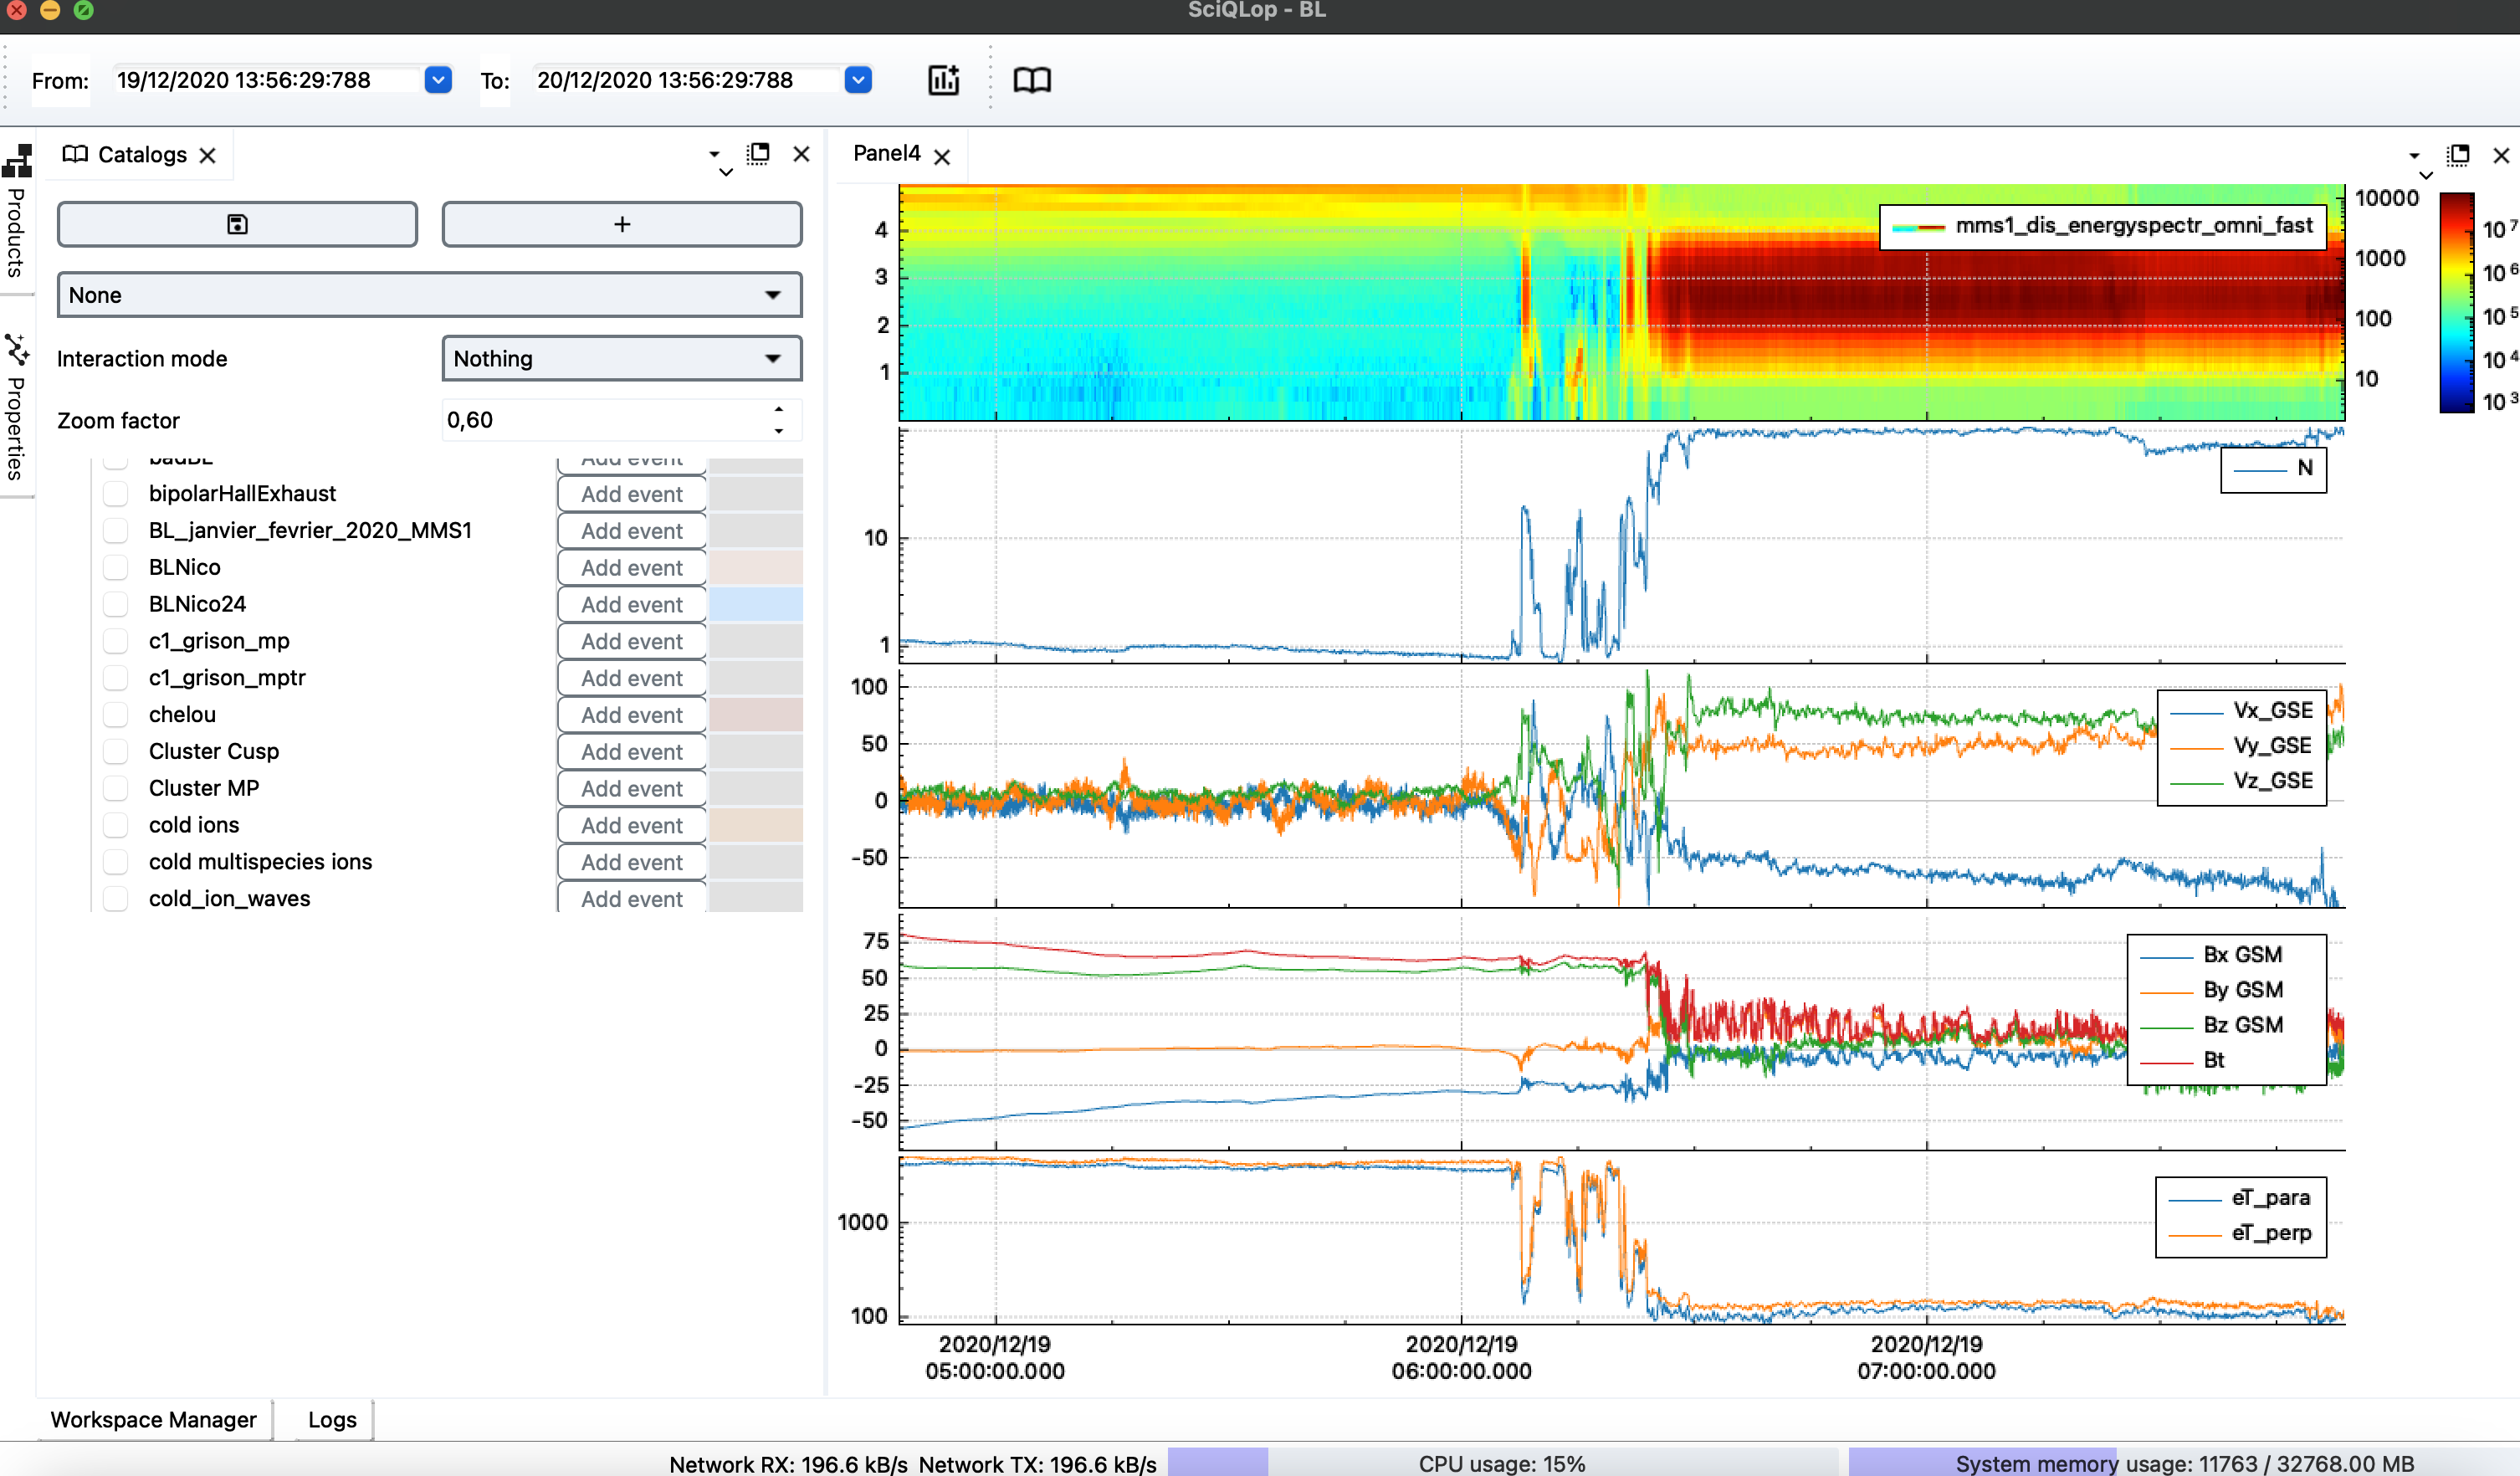
The tree groups catalogs by where they come from:
- My Catalogs is your own library, stored on your computer.
- Remote mirrors read-only catalogs from AMDA and other services.
- Shared holds catalogs you edit live with collaborators.
A colour swatch sits in front of each catalog name. It is the colour of that catalog’s events on the plots. Double-click the swatch to pick another colour.
Let’s create our first catalog. Under My Catalogs, double-click the grey New catalog… row, type a name and press Enter. Right-clicking My Catalogs and choosing New catalog… does the same. Now select the new catalog. The table on the right lists its events: none for now. It has a start and a stop column, and every piece of metadata you add later gets its own column.
Next, show the catalog on the plot panel. Drag the catalog from the tree and drop it onto the panel. Two other ways:
- right-click the catalog in the tree and choose Add to panel ’…’
- right-click the panel, open the Catalogs submenu and tick the catalog
Creating an event
Each plot panel has its catalog controls at its bottom, next to the time controls:
- Catalog mode:
View,JumporEdit. Ctrl+Shift+M cycles through them. - Add to: in
Editmode, the catalog that receives new events. - Zoom out: in
Jumpmode, how much context to show around an event.
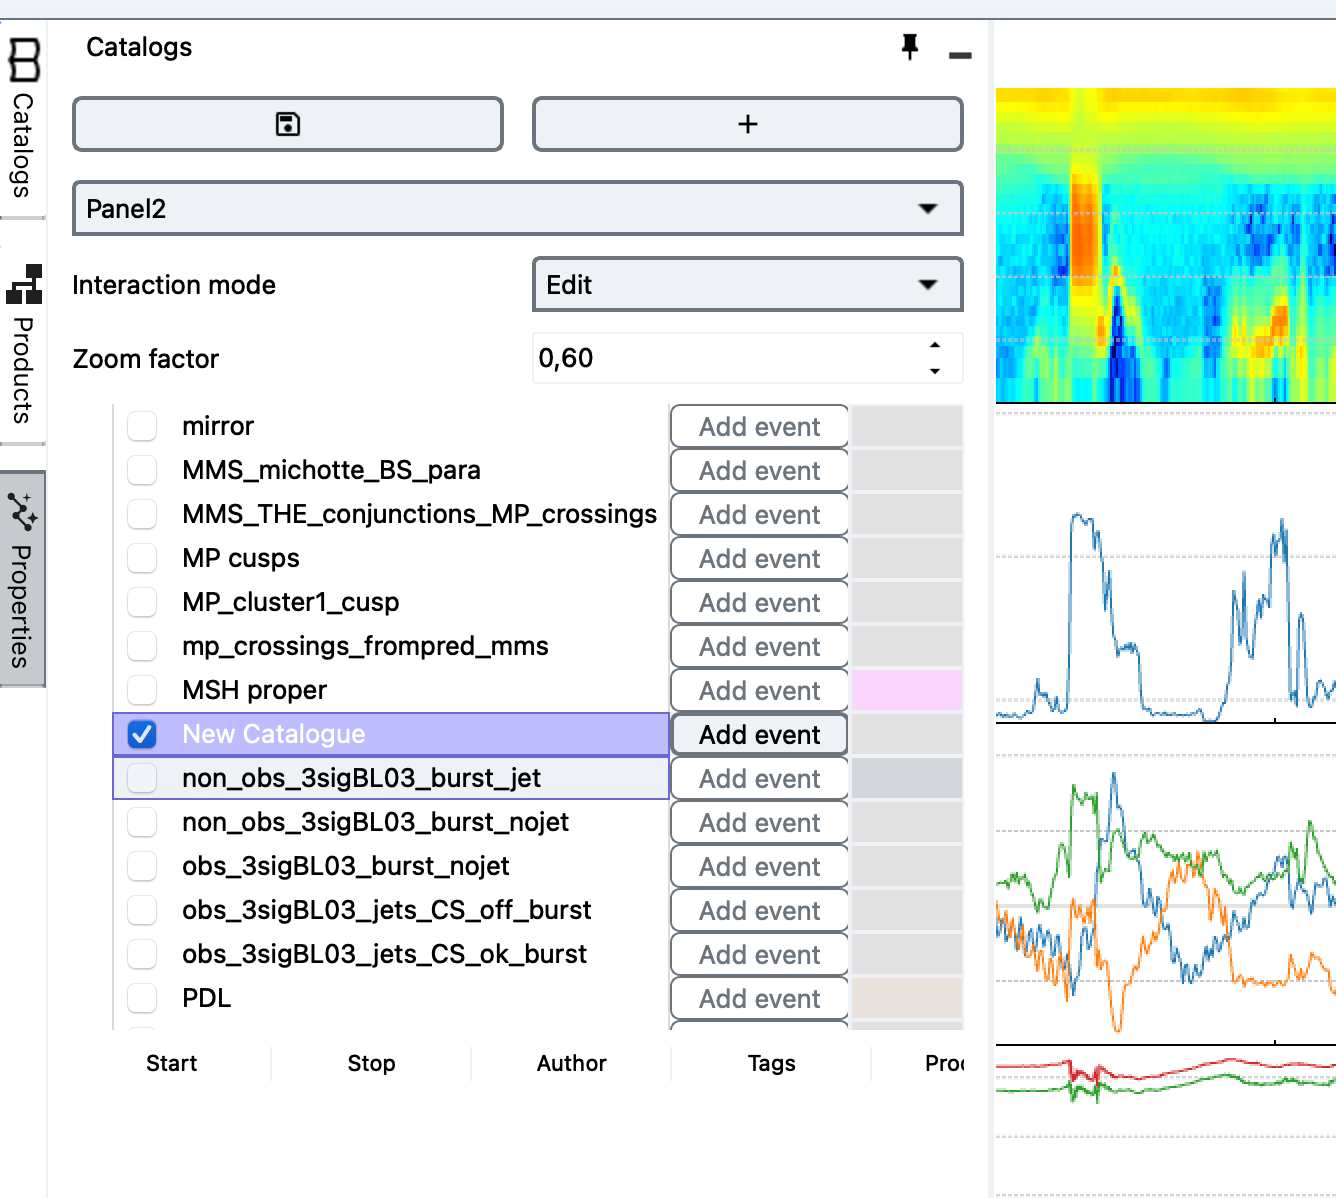
Set Catalog mode to Edit and check that Add to shows your new catalog. Then:
- Hold Shift and click on a plot. This starts the event.
- Move the mouse to the other end of the event.
- Click again to finish it. Esc cancels.
The event appears as a coloured zone spanning all plots of the panel, and as a new row in the event table.
Show the catalog first, then pick the mode
In v0.13, on a panel with no catalog yet, the mode box changes but the panel keeps its old mode. Once a catalog is on the panel, the mode box works as expected.
The Add event button above the event table is another way. It drops an event at the center of the panel you are working in, one tenth of the visible range wide.
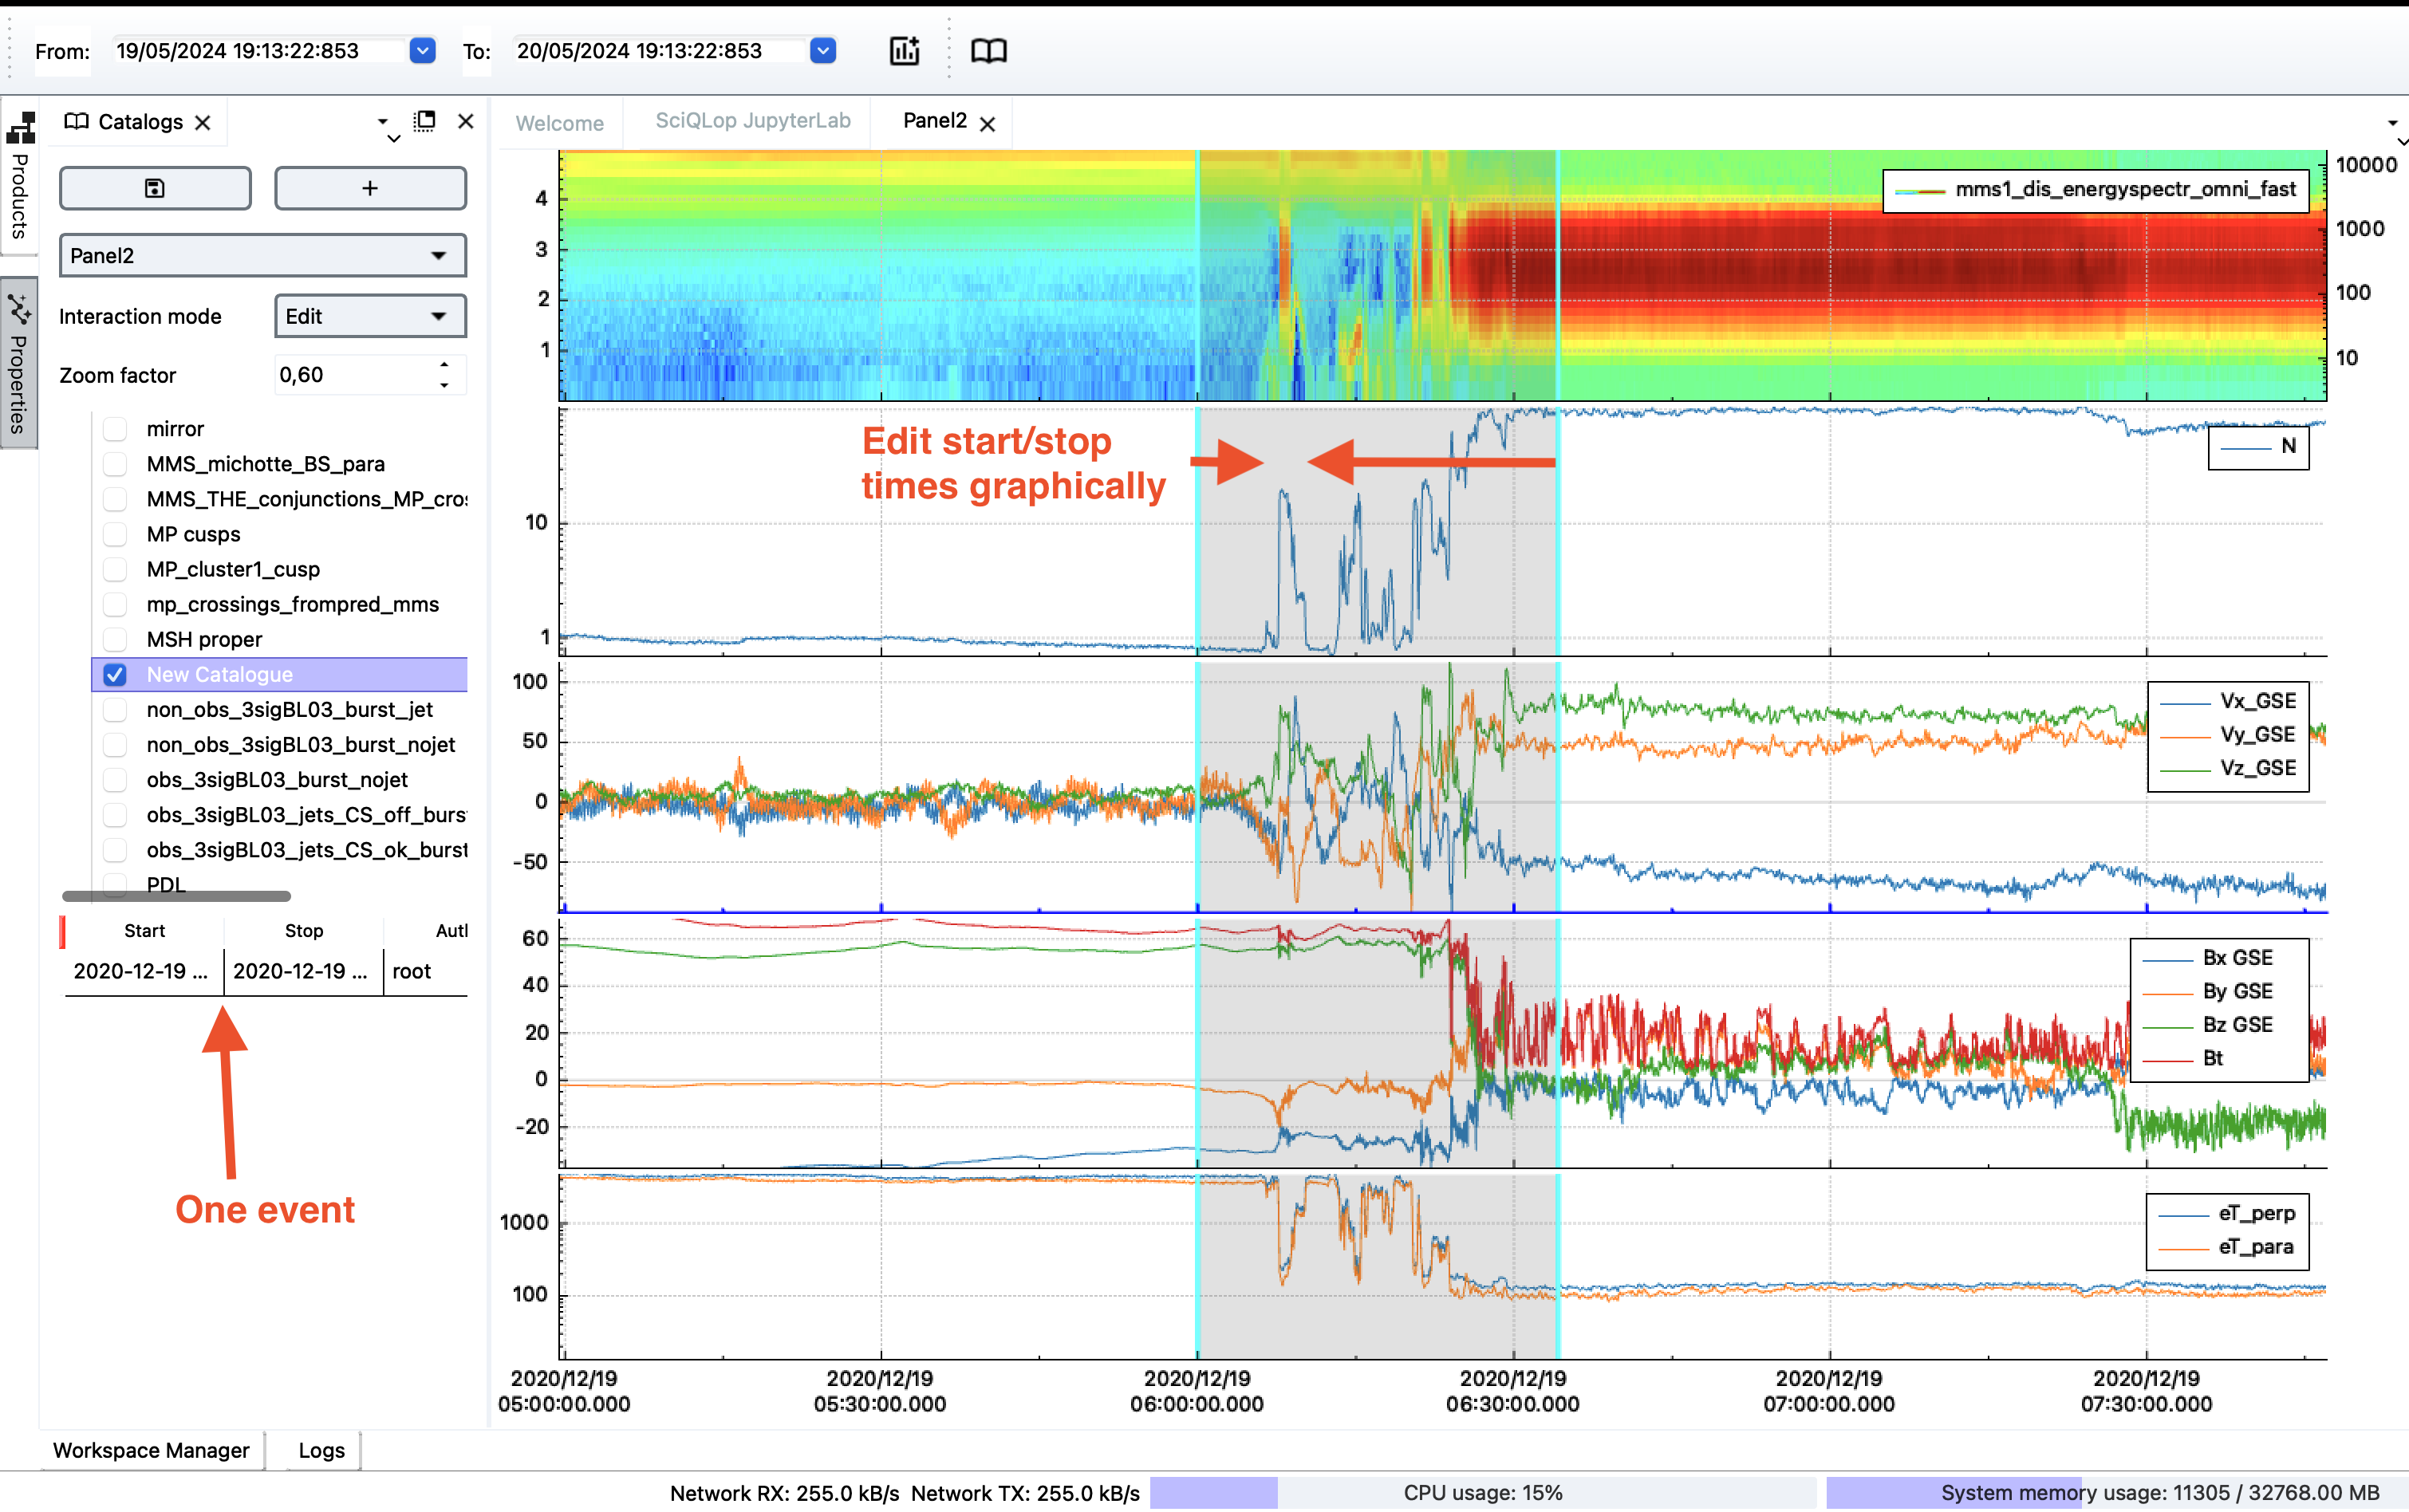
We want the event to define the first boundary layer encounter from the magnetosphere. To do that, click on the left (resp. right) border of the event, the light blue line should turn into a darker blue, indicating the border is now selected. Just select it and slide it to the right (resp. left). Notice the start and stop times in the event table dynamically change as you slide the borders.
You can also press the left mouse button in the colored zone representing the event and slide the whole zone left/right to adjust the location of the event. This only works in Edit mode. In View and Jump modes the events are locked.
One great advantage of SciQLop is that zooming in and out is super efficient therefore precisely defining the start and stop times of the events is super easy. Here is the event selected precisely on a zoom around it.
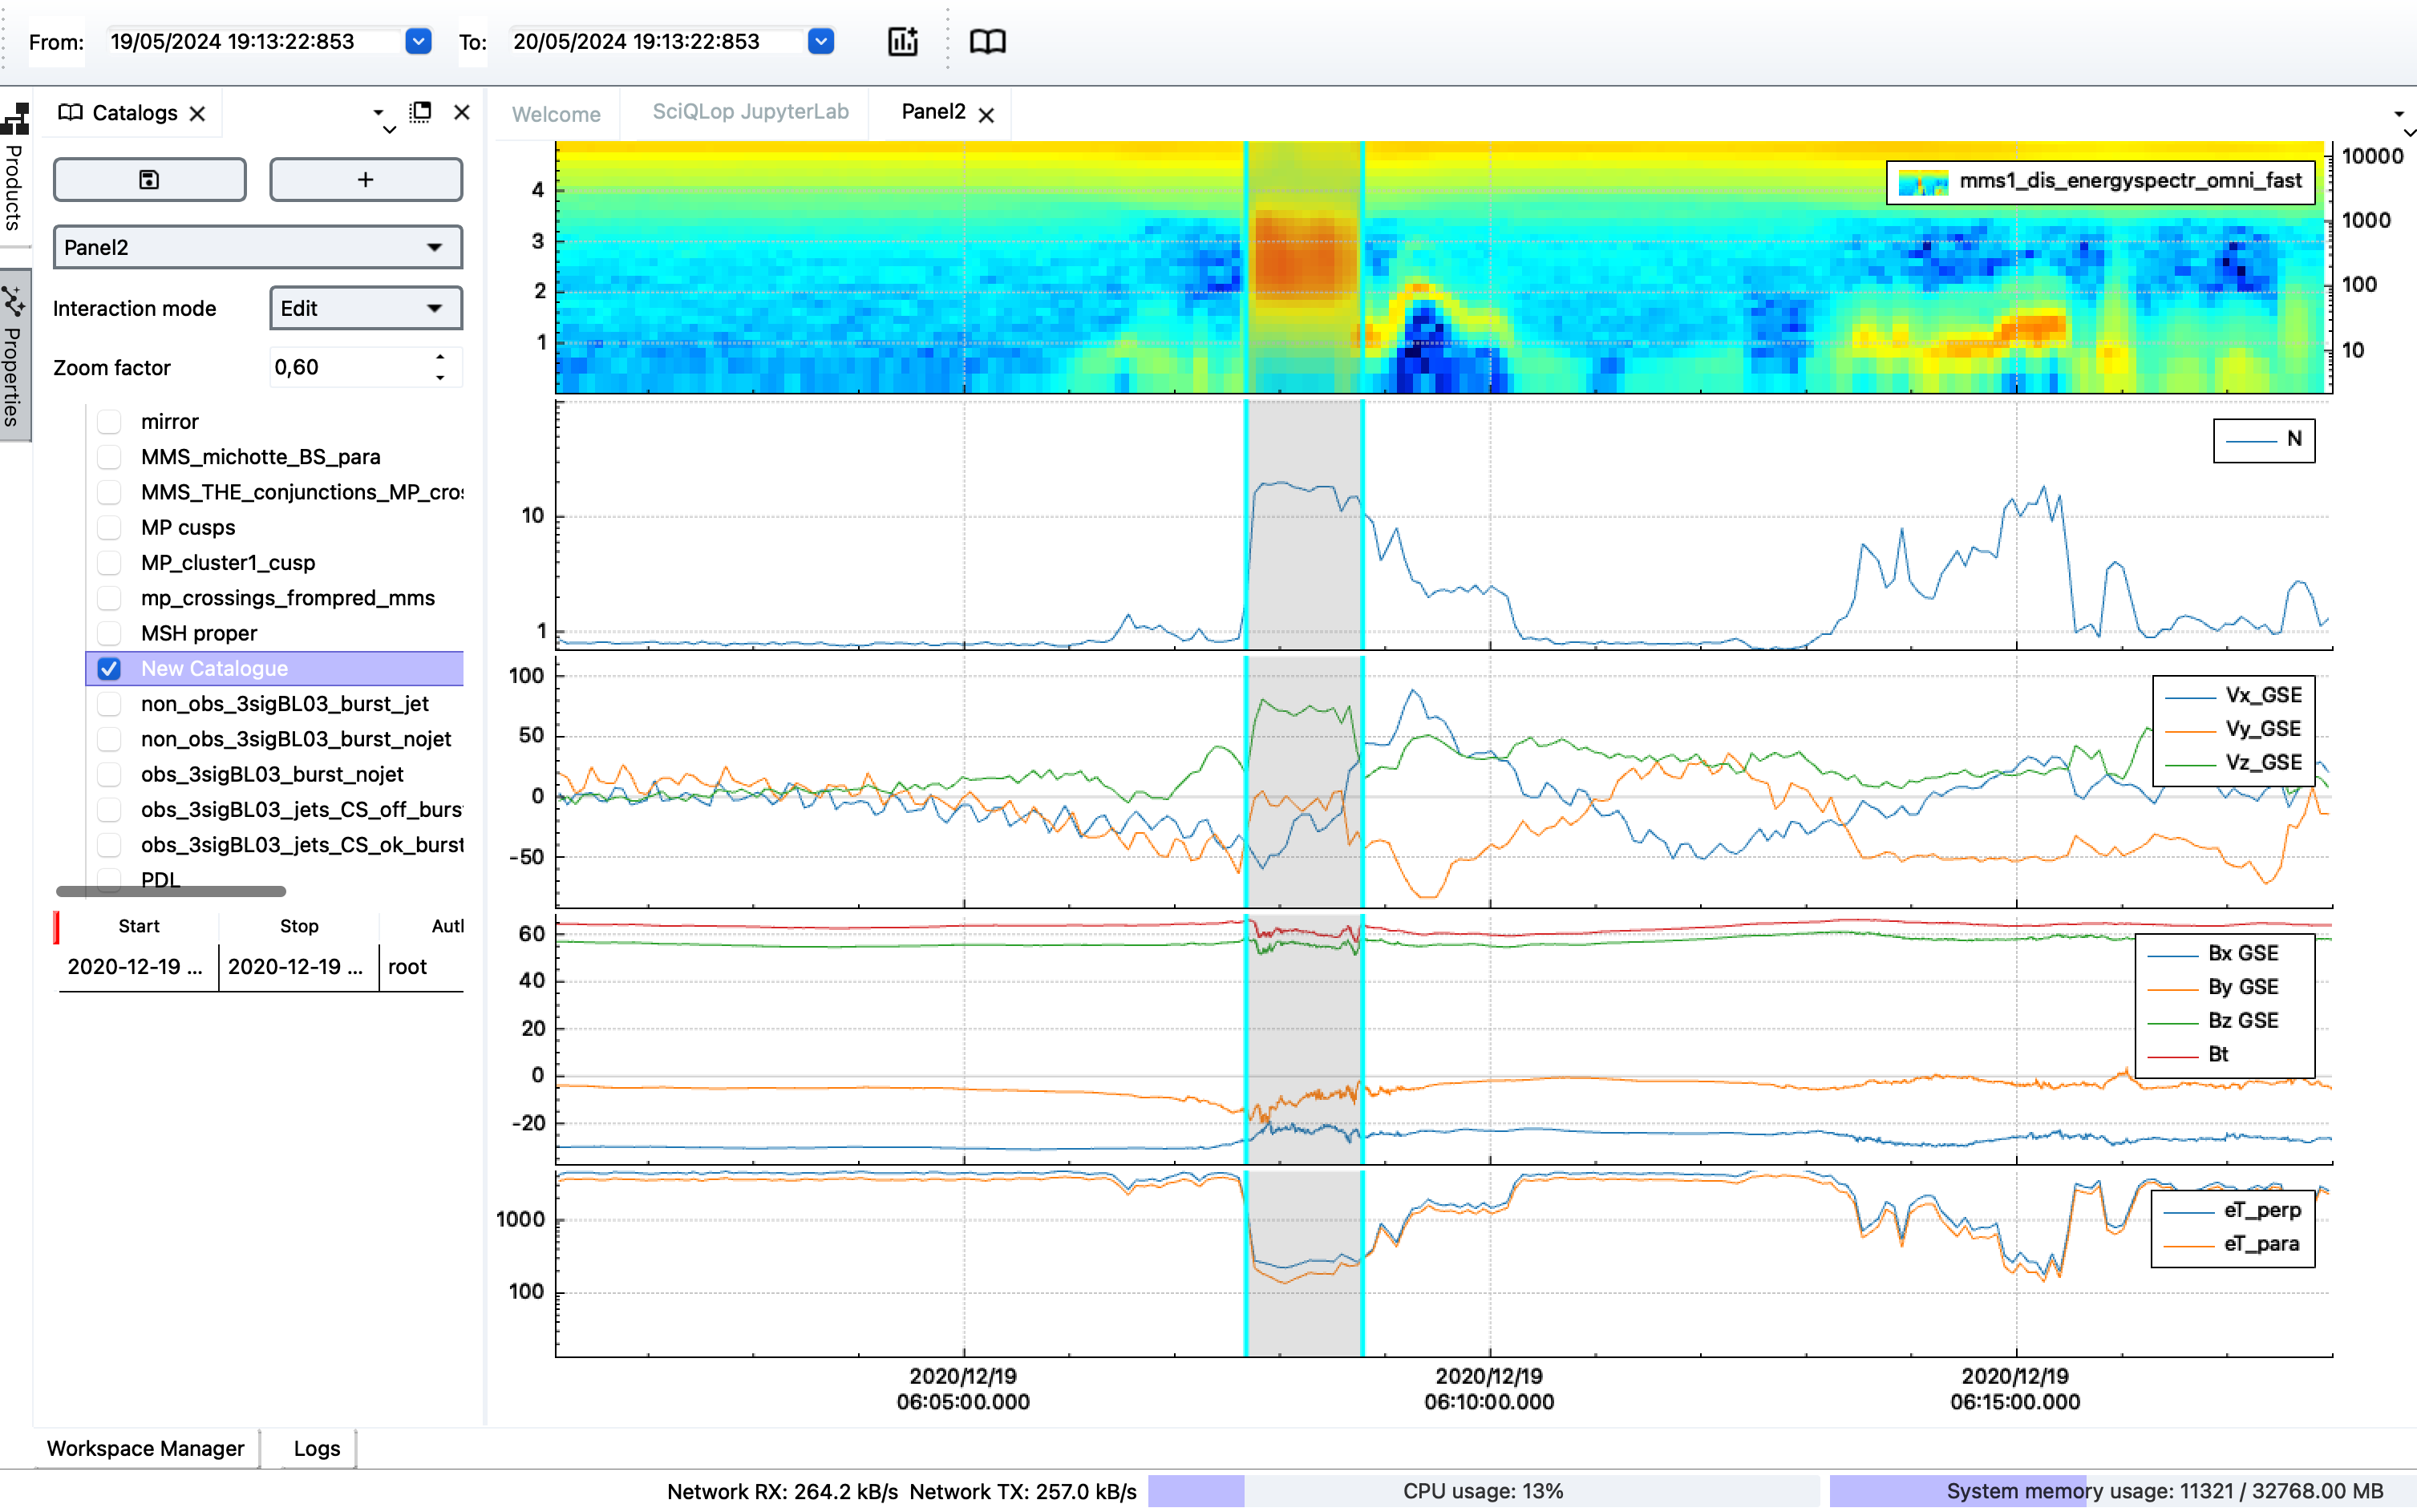
You can also type the times: double-click a start or stop cell in the event table.
Do not forget to SAVE your modifications
Any modification to a catalog, whether it is creating, deleting, adjusting the borders of an event etc. will not be automatically saved. When something is unsaved, a save icon appears next to My Catalogs in the tree: click it for your modifications to persist. Right-clicking the catalog also offers Save catalog. If you quit with unsaved changes, SciQLop asks first.
Let’s continue to add more events, the following screenshot shows two additional ones:
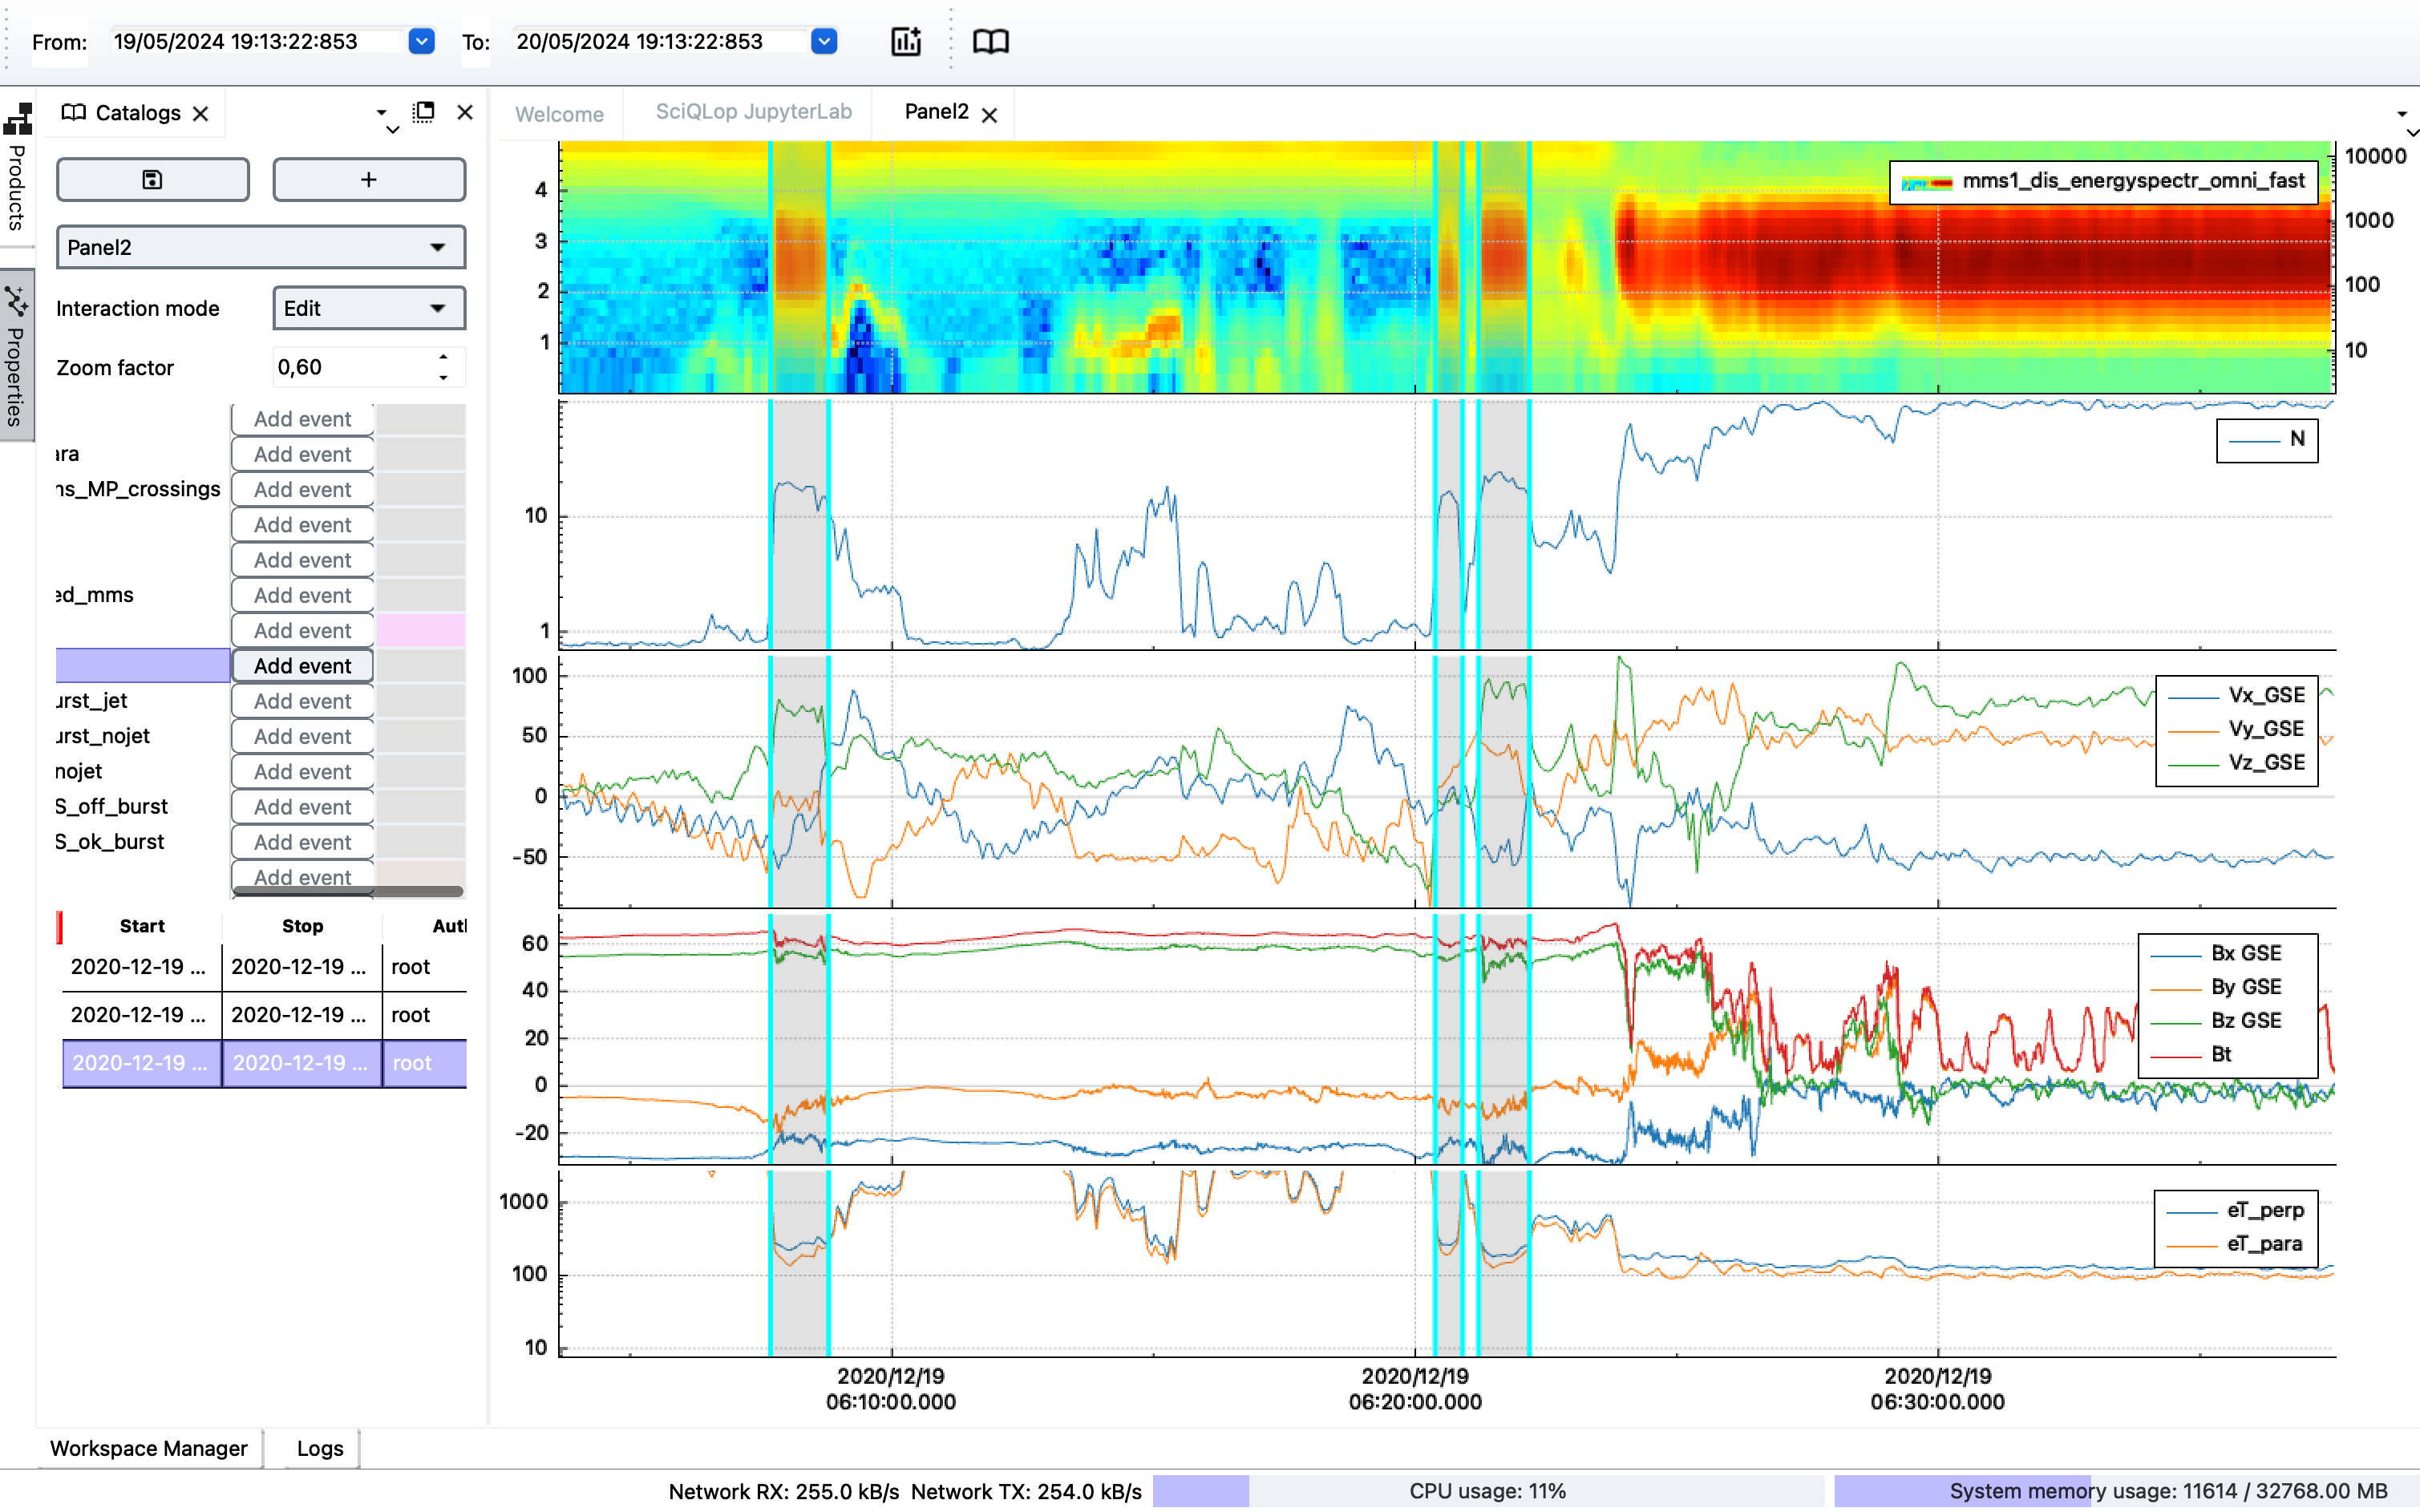
Reviewing events
Now we have multiple events in our new catalog. Say we want to review them one by one, that is, inspecting some data for the time intervals of each of the events. In the case of the above dummy catalog, all three events are close to each other so what you would probably do is scrolling in time and zooming around each of them.
However, most of the times, your events will be far in time from one another, possibly months or even years apart. Scrolling in time would not be a smart option as it would trigger lots of useless downloads.
SciQLop allows users to “jump” from one event to another. To do that, change the Catalog mode to Jump. In this new mode, you will not be authorized to edit the event position and boundaries as we did above. However, selecting an event in the event table will automatically set the time range of the panel around the selected event.
Zoom out
The Zoom out box, shown in
Jumpmode, sets how much context you get around an event. The visible range is that many times the event duration, centered on the event. The default×2leaves half an event of margin on each side.×1fills the panel with the event.
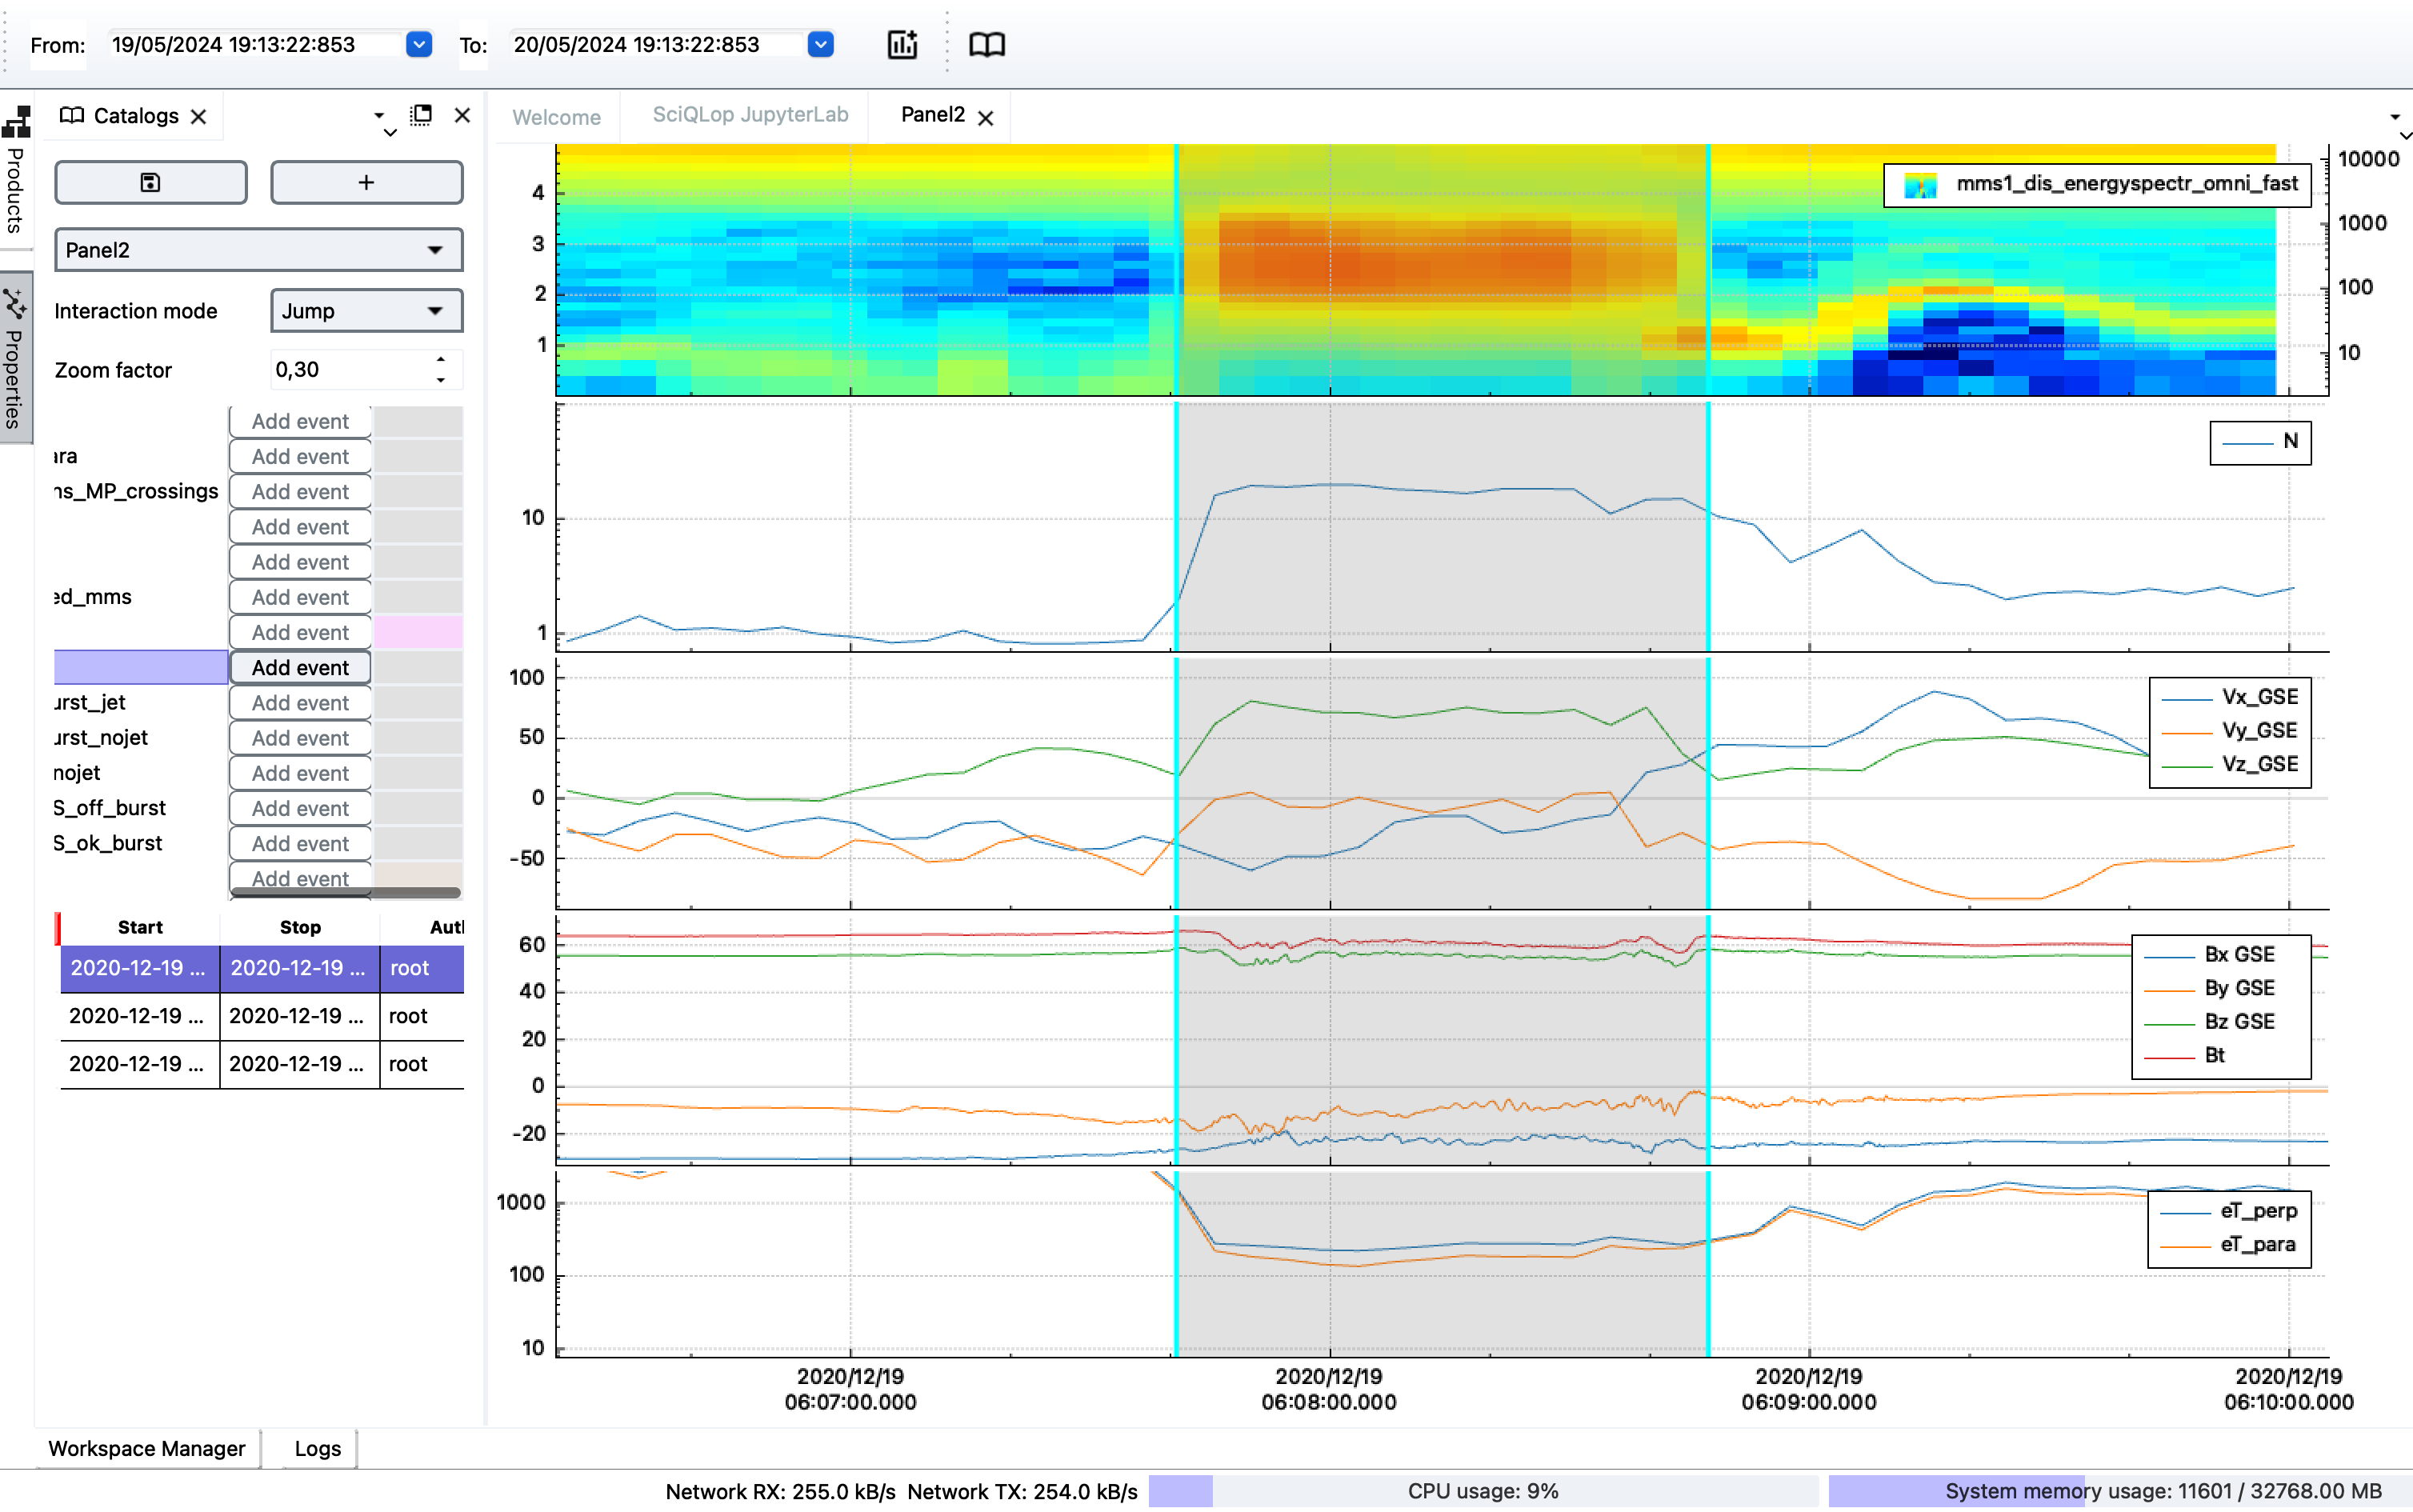
In above screenshot, we selected the first event on the list.
Now, selecting events one after the other, either by clicking on it, or with the arrow keys of your keyboard, will jump from one event to the next, letting you review tons of events in no time.
Renaming and metadata
Let us now rename our catalog, and also set some metadata. Everything happens in the Catalogs tab:
- To rename a catalog, double-click its name, or right-click it and choose Rename….
- To edit an event’s metadata, edit its cell in the event table. Select several rows before editing a cell, and the new value goes to all of them.
- Add attribute…, above the table, adds a metadata column to the selected events, or to all events when none is selected.
- Columns shows, hides and reorders the table columns.
- The filter boxes above the tree and the table search catalogs and events.
- Drag events from the table onto another catalog to add them there too. Hold Shift to move them instead, or Ctrl to make independent copies.
The screenshots below show the old catalog explorer window. It is gone: the Catalogs tab shows the same events and fields. The full TSCat editor is still one click away: right-click My Catalogs and choose Open in TSCat editor….
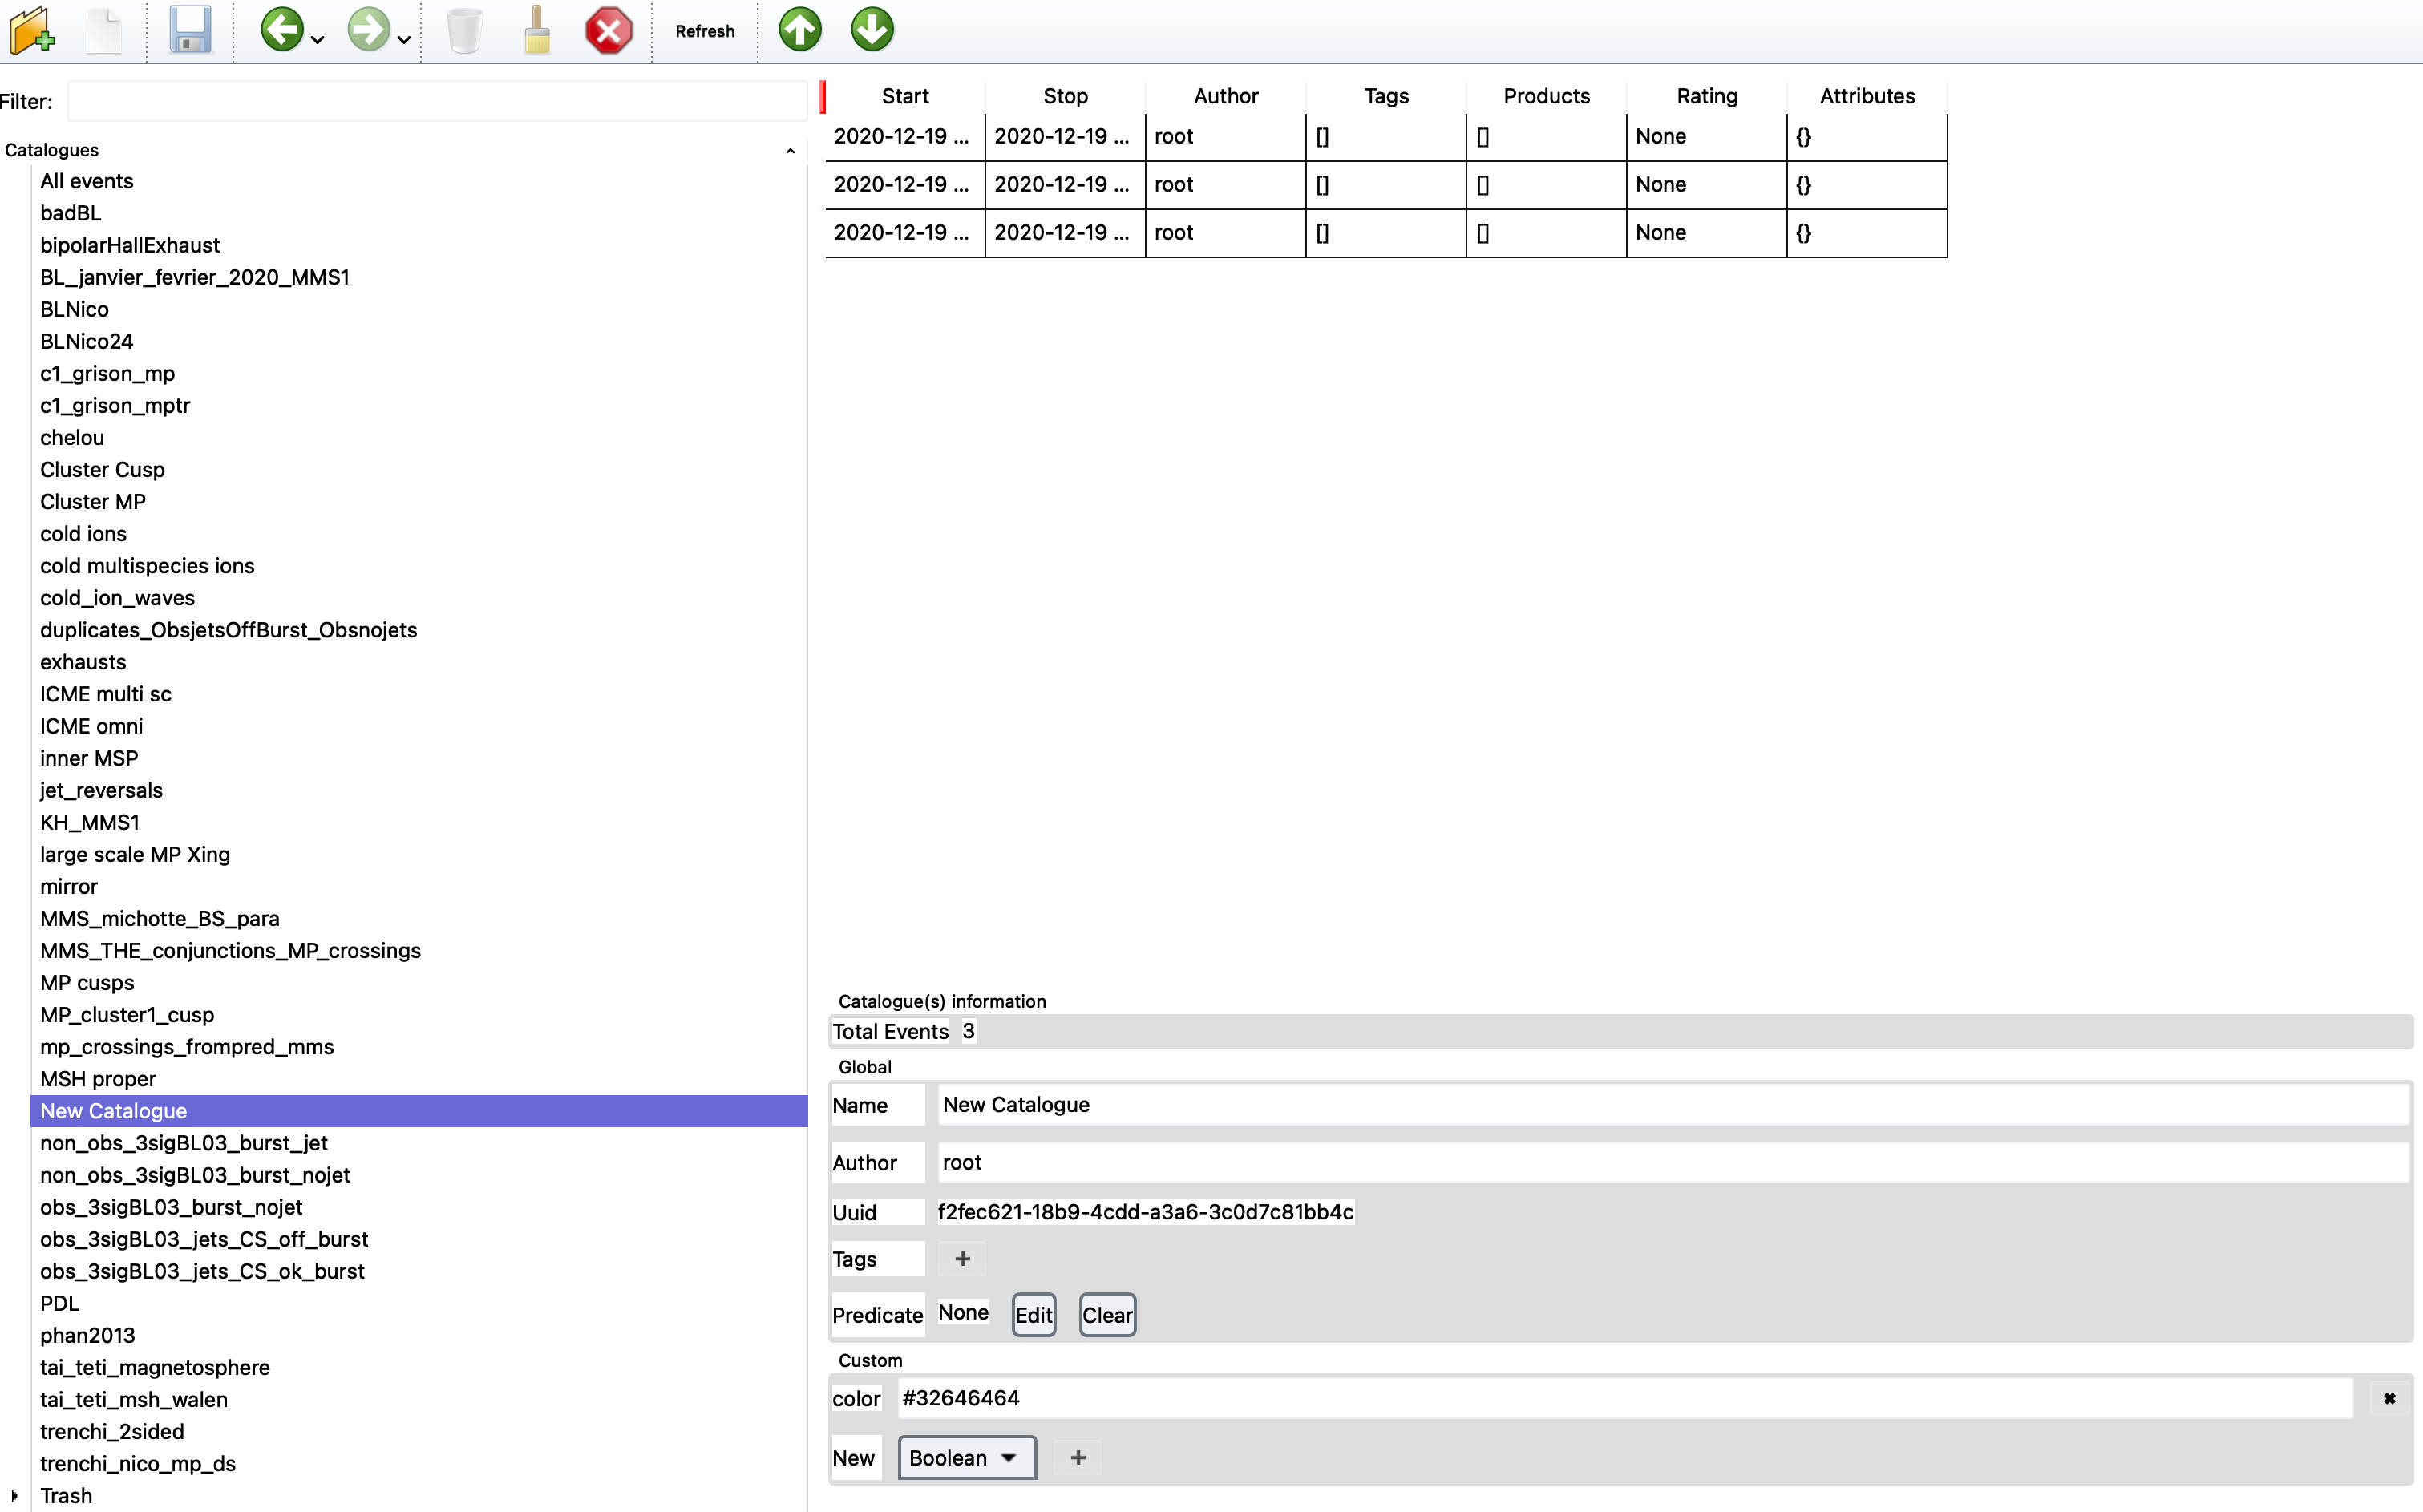
Catalog overlays: several catalogs on one panel
So far we have worked with a single catalog, but nothing stops you from showing several at once. Drag two or three catalogs onto the panel, and all of them get drawn: the events of each catalog appear as coloured zones in that catalog’s own colour, so a magnetosheath interval from one catalog and a magnetopause crossing from another are told apart at a glance. The zones span all the plots of the panel, exactly like the event we created above. The event table still shows one catalog at a time: the one selected in the tree.
SciQLop picks each catalog’s colour from a palette of nine colourblind-safe colours, so two catalogs can occasionally end up with the same one. To change it, double-click the catalog’s swatch, or right-click the catalog and choose Set color…. Reset color goes back to the automatic one.
You can also colour the events within a catalog: right-click the catalog and open Color by…. Uniform (default) is one colour for the whole catalog. Choosing a metadata column instead colours each event by its value: one colour per distinct label for text columns (Category colors… lets you pick them), a colormap for numeric ones (Configure colormap… lets you pick the colormap and its min/max).
You can also manage catalogs without leaving the plot. Right-click on the panel and open the Catalogs submenu. It lists every catalog with a checkbox. Each catalog already shown on the panel gets its own entry on top, with Remove from panel, the colour actions and Color by…. The Mode submenu there switches the catalog mode too.
Building a catalog from data
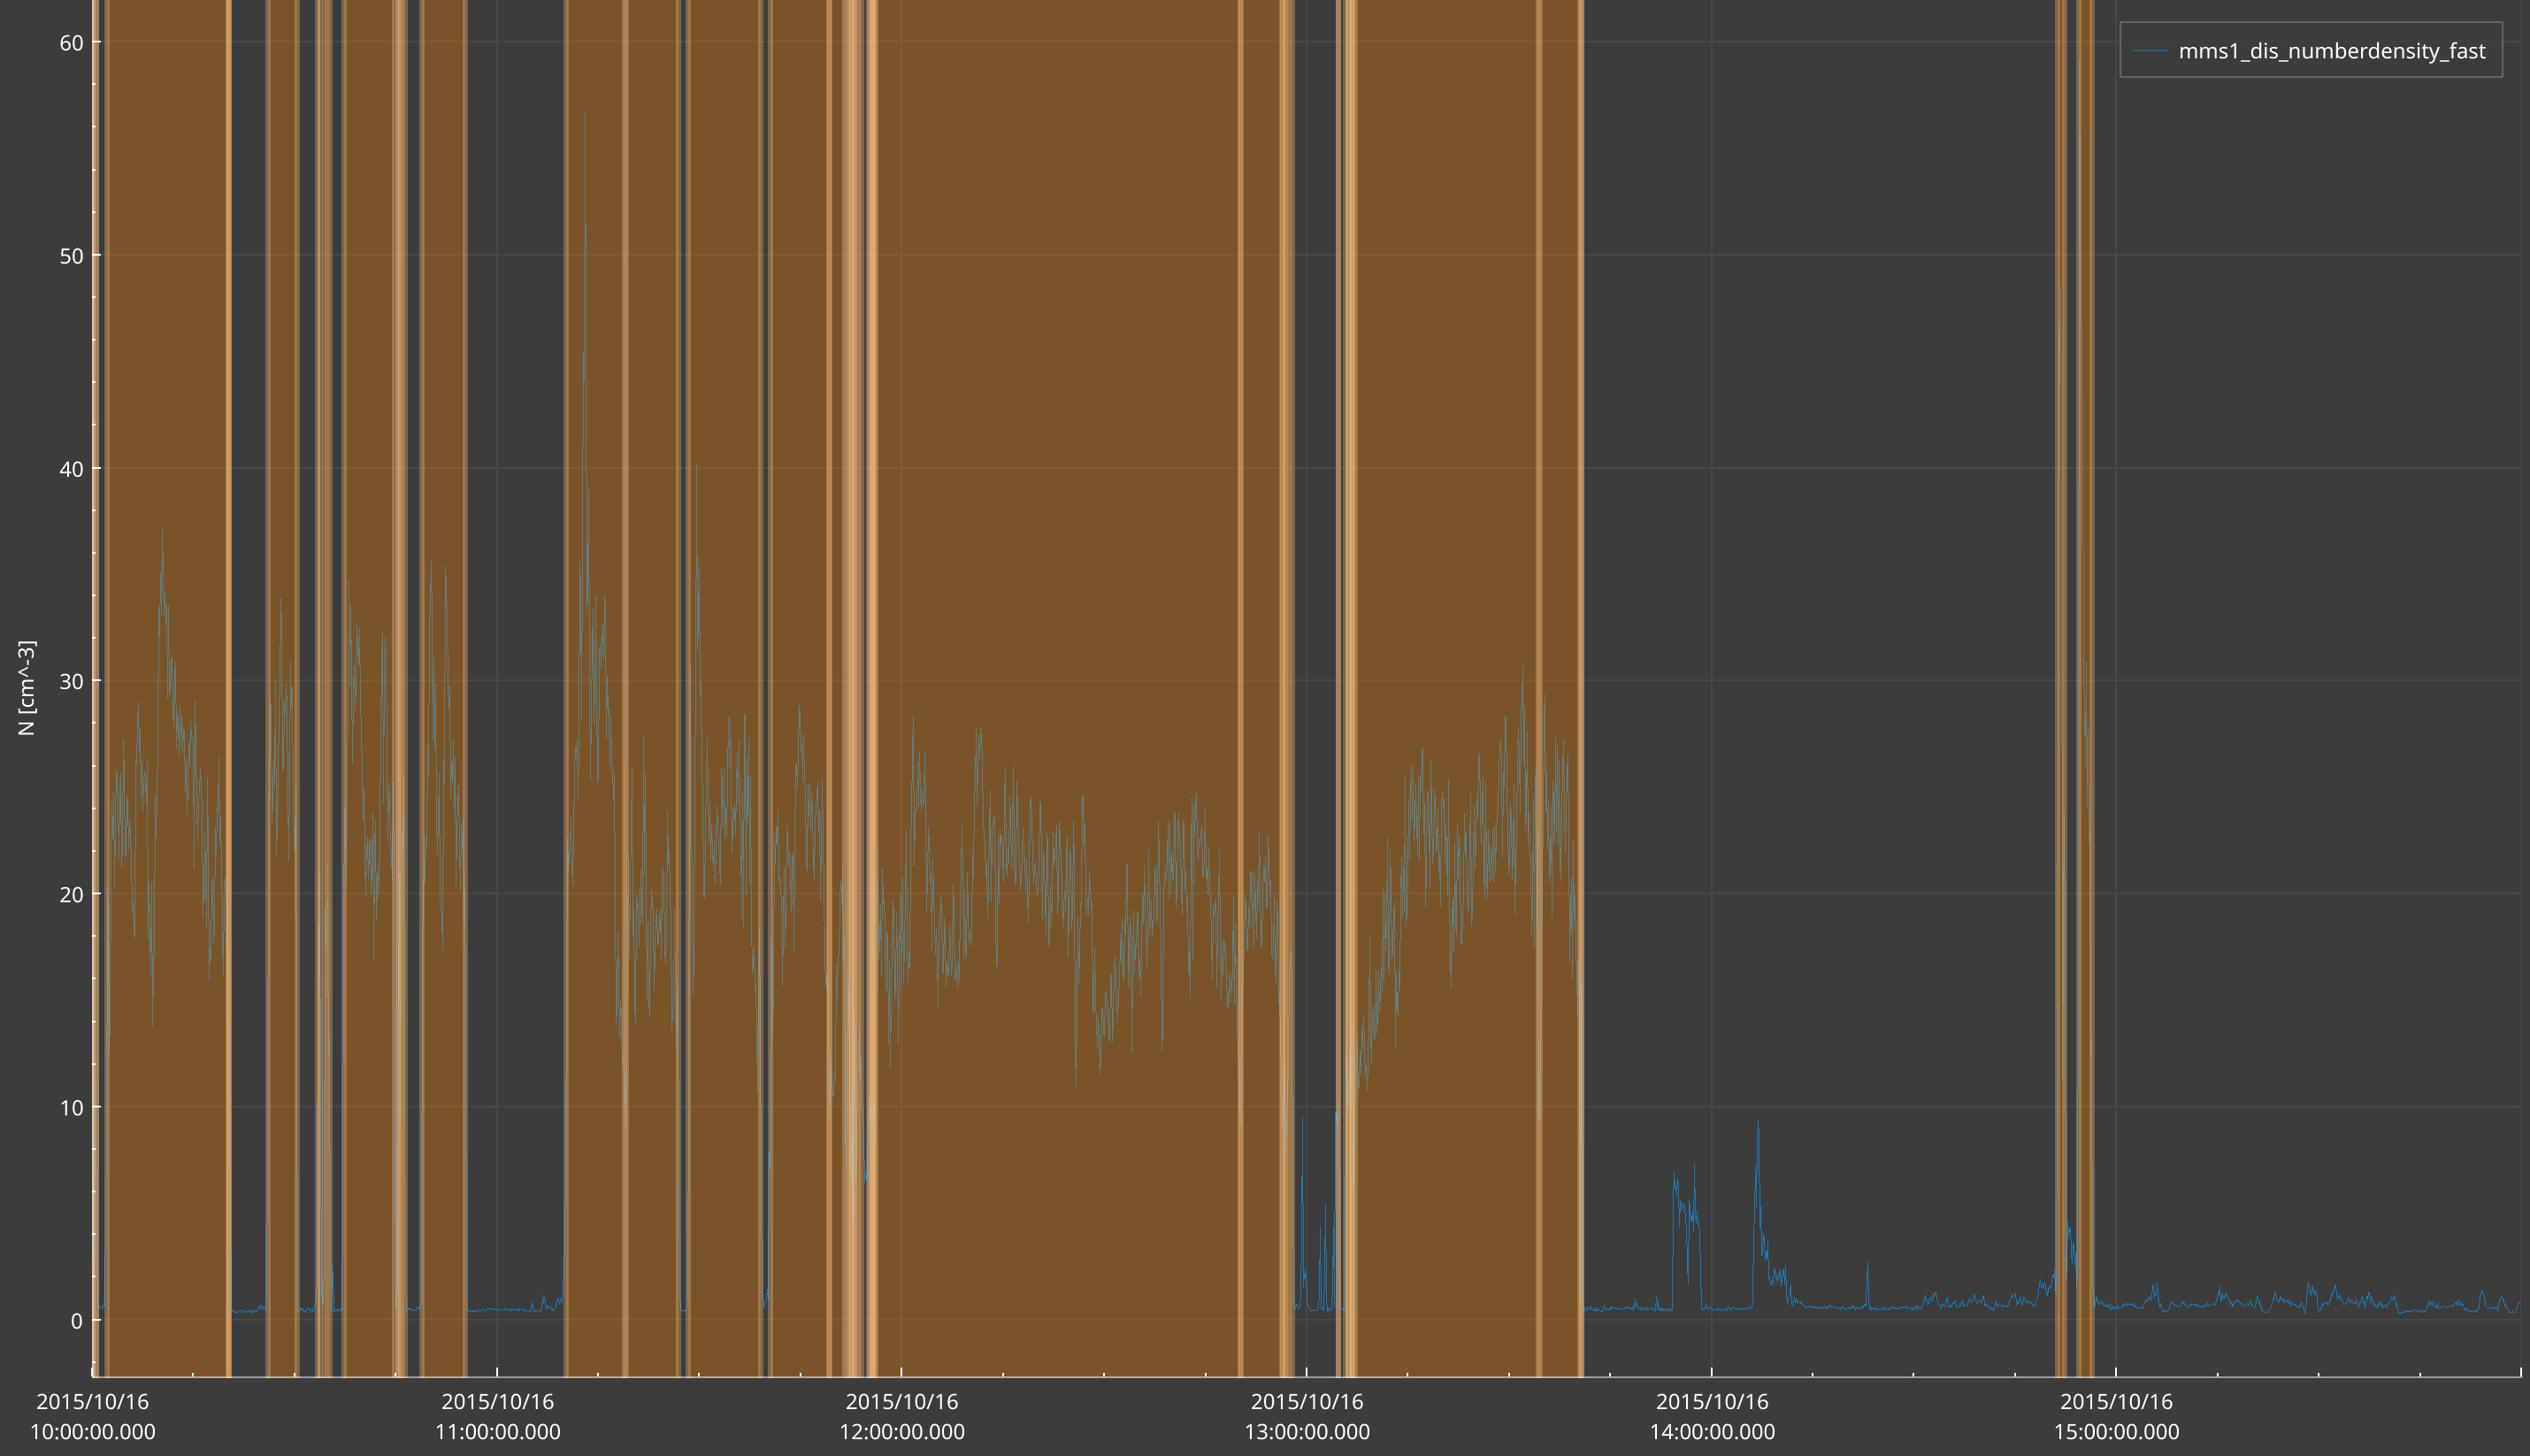
Catalogs do not have to be drawn by hand. The SciQLop.user_api.catalogs module creates them from Python, for instance from a notebook opened in SciQLop. Let’s build one from the MMS1 ion density: intervals where the density exceeds 10 cm⁻³ are a crude but effective magnetosheath detector.
import numpy as np
import speasy as spz
from datetime import datetime
from SciQLop.user_api import TimeRange
from SciQLop.user_api.plot import create_plot_panel
from SciQLop.user_api.catalogs import catalogs

start, stop = datetime(2015, 10, 16, 10), datetime(2015, 10, 16, 16)
panel = create_plot_panel()
panel.time_range = TimeRange(start, stop)
panel.plot("speasy//cda//MMS//MMS1//DIS//MMS1_FPI_FAST_L2_DIS_MOMS//mms1_dis_numberdensity_fast")

n = spz.get_data("cda/MMS1_FPI_FAST_L2_DIS-MOMS/mms1_dis_numberdensity_fast", start, stop)
inside = n.values[:, 0] > 10
edges = np.diff(inside.astype(np.int8), prepend=0, append=0)
starts, stops = np.flatnonzero(edges == 1), np.flatnonzero(edges == -1) - 1
events = [(n.time[a], n.time[b], {"region": "magnetosheath"}) for a, b in zip(starts, stops)]

catalogs.save("My Catalogs//magnetosheath", events)
print(catalogs.list("My Catalogs"))
Catalog paths are //-separated like product paths, and the first segment is the provider: My Catalogs is the local one you have been using in the catalog tab. Each event is a (start, stop) or (start, stop, metadata) tuple, and any datetime-like value works for the bounds (here numpy.datetime64 straight from speasy). catalogs.save creates the catalog if needed and replaces its events otherwise, so you can rerun the cell after tweaking the threshold; catalogs.create refuses to overwrite an existing catalog, catalogs.add_events appends to one, and catalogs.get returns it as a speasy.Catalog.
The new catalog shows up in the catalog tab immediately: drag it onto the panel to see its zones. And as with events drawn by hand, click the save icon next to My Catalogs to write it to disk.
The notebook can also attach the overlay itself, with PlotPanel.add_catalog_overlay:
overlay = panel.add_catalog_overlay("My Catalogs//magnetosheath", override_color="#50FF8800")
overlay.remove()  # or panel.remove_catalog_overlay(overlay)
override_color takes a Qt colour string. A colour name or #RRGGBB is opaque, and the zones hide the data underneath. So give it an alpha with Qt’s #AARRGGBB form. #50 (80/255) is the palette’s default transparency.
Next release
A catalog can stay attached to a panel without drawing its zones: untick Show spans in its entry of the panel’s Catalogs menu, or pass
show_spans=Falsetoadd_catalog_overlay.Jumpmode still works with it. Handy for a catalog you only navigate with, like a list of flybys.