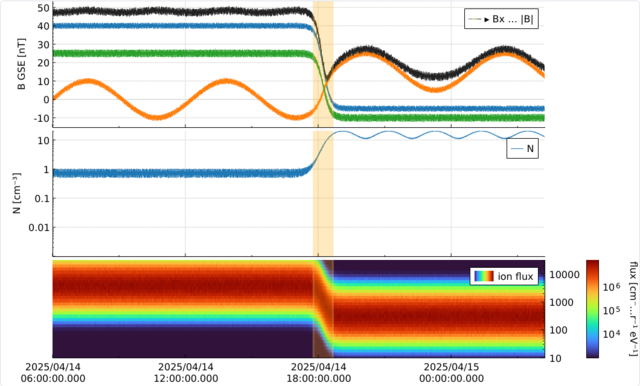
A spacecraft crossing
Field, density and an ion spectrogram, SciQLop-style.
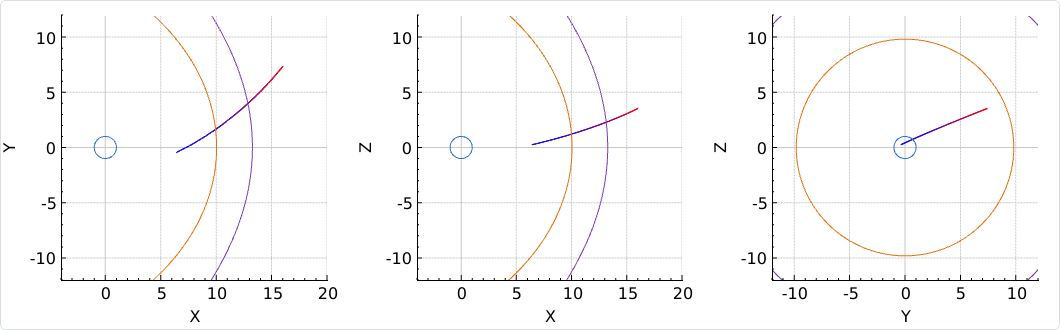
MMS crosses the bow shock
Real MMS data, the orbit in three projections, magnetopause and bow shock models.
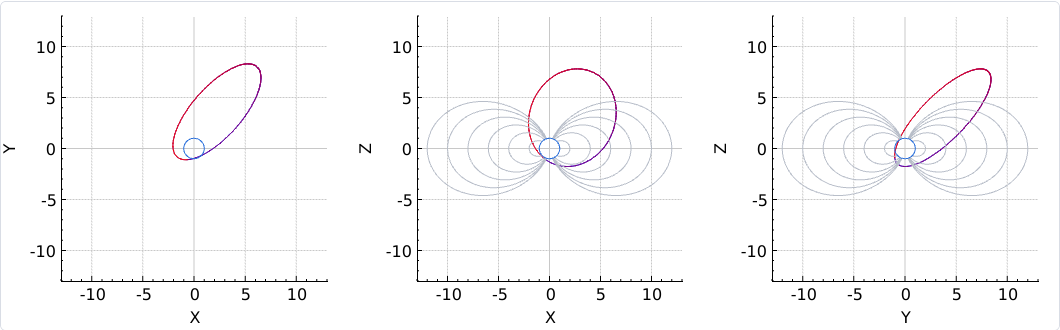
An orbit through a dipole
Field along an orbit, the orbit in three projections, dipole field lines.
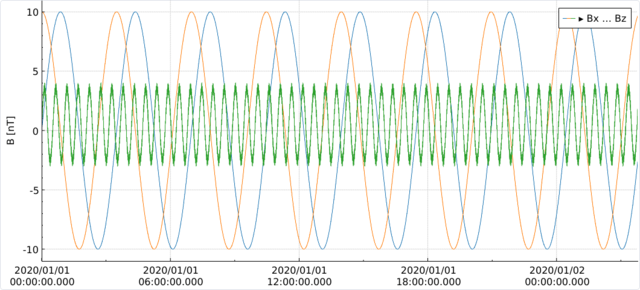
Getting started
One panel, a three-component line.
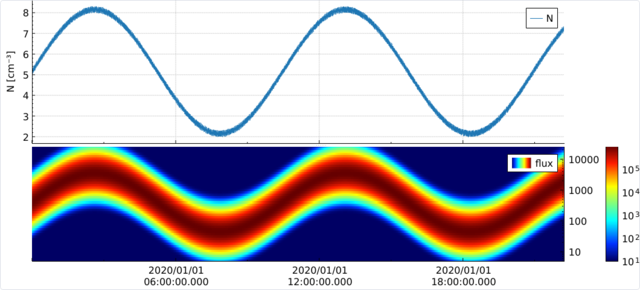
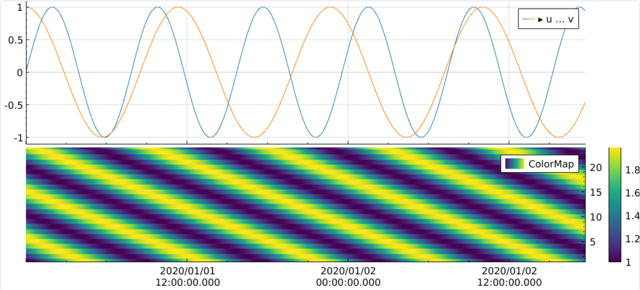
Spectrogram
Log/log colour map under a line, gradients.
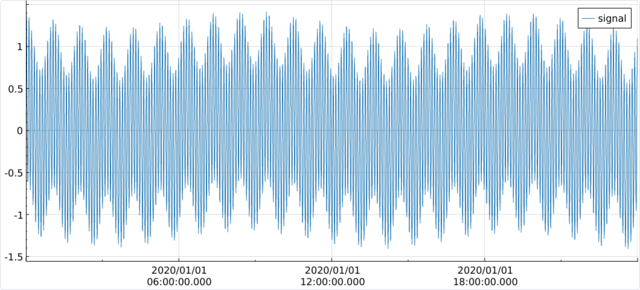
Data on demand
Refetch for the range in view after a pan or zoom.
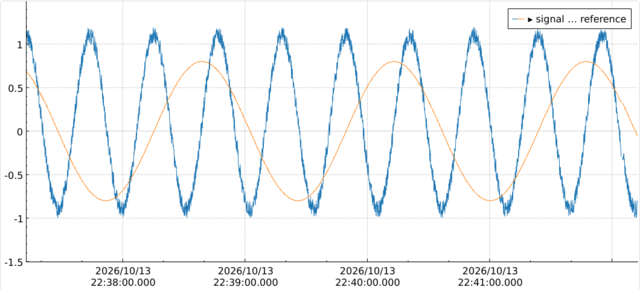
Live stream
Samples arrive ten times a second; the view follows.
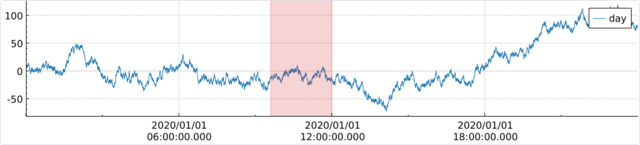
Overview and detail
A span on an overview drives a detail panel.
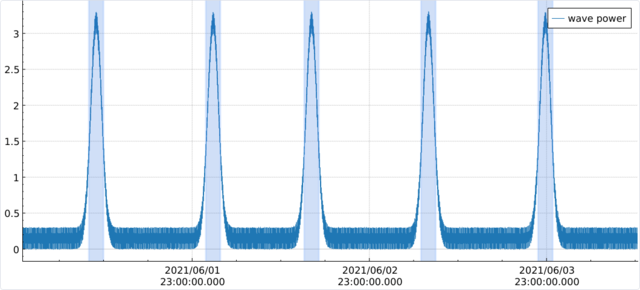
Event catalogue
Events as spans: click to zoom, drag to edit, Delete to remove.
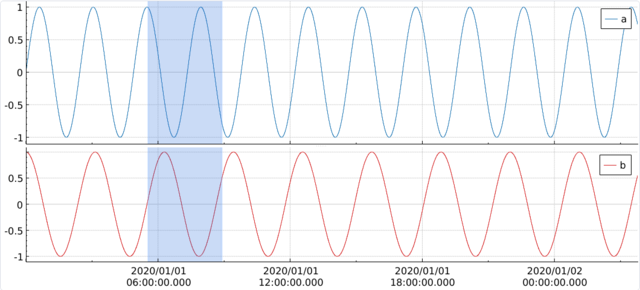
Spans and export
Draggable spans; PNG and PDF export.
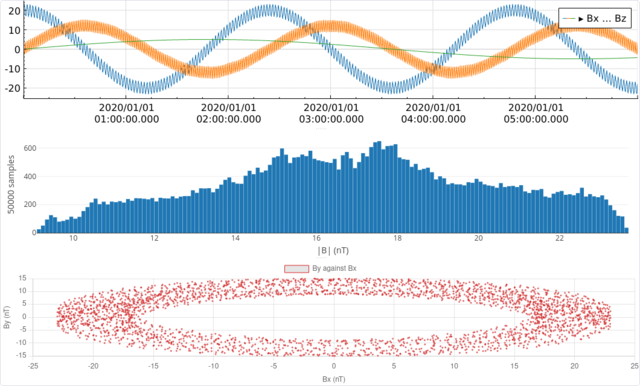
Other chart libraries
Plotly and Chart.js rows that follow the time range.
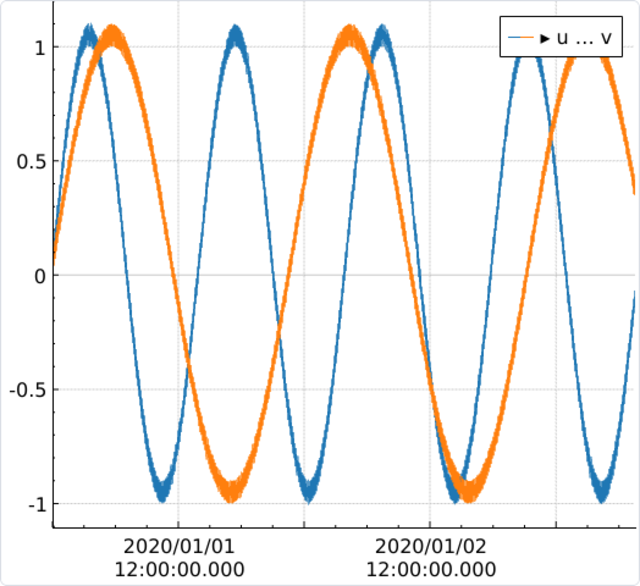
Several panels
Panels side by side, light and dark.
Themes
Built-in and custom themes, switched live.
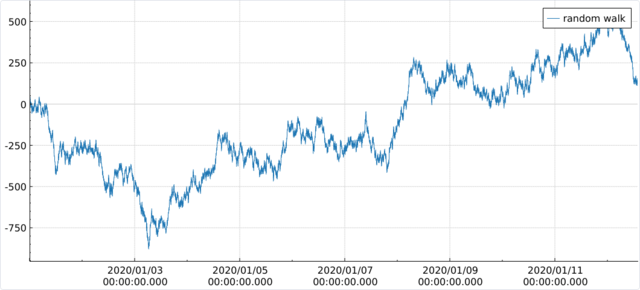
Ten million points
Resampled on worker threads.