Annotating plots with graphic primitives
A figure for a paper or a talk usually needs a few marks on top of the data: a line at the event, a label, an
arrow pointing at the feature you discuss. SciQLop.user_api.plot exports static primitives for that: Text,
CurvedLine (with LineTermination arrow heads), VerticalLine, HorizontalLine, StraightLine,
HorizontalSpan, RectangularSpan, Ellipse and Pixmap. Each is drawn on one plot and follows it when you
pan or zoom.
For marks that must recompute when the data changes, use annotation layers (SciQLop.user_api.layers) instead.
NOTE: Product paths are
//-separated strings.
The panel
The example is the MMS1 magnetopause crossing of 2015-10-16 (the Burch et al., 2016 event): FGM burst B in GSM on top, FPI-DIS burst ion density below. MMS1 leaves the magnetosphere at 13:05:45; the density jumps from about 0.4 to 11 cm⁻³ and Bz flips sign.
from datetime import datetime, timezone
from SciQLop.user_api import TimeRange
from SciQLop.user_api.plot import create_plot_panel

p = create_plot_panel()
p.time_range = TimeRange(datetime(2015, 10, 16, 13, 5, 25), datetime(2015, 10, 16, 13, 7, 35))
b_plot, _ = p.plot("speasy//cda//MMS//MMS1//FGM//MMS1_FGM_BRST_L2//mms1_fgm_b_gsm_brst_l2")
n_plot, _ = p.plot("speasy//cda//MMS//MMS1//DIS//MMS1_FPI_BRST_L2_DIS_MOMS//mms1_dis_numberdensity_brst")
PlotPanel.plot returns (plot, graph); the plot is what primitives attach to. Existing plots are also
reachable as p.plots[i].
Coordinates
Text, CurvedLine, VerticalLine, StraightLine, Ellipse and Pixmap take a coordinate_system keyword
(SciQLop.user_api.plot.enums.CoordinateSystem). HorizontalLine and the two spans always use data coordinates.
Data(default): X and Y are data values. On a time-series plot X is a Unix timestamp in seconds, so build it from a tz-awaredatetime(...).timestamp(). The mark moves with the data.Pixel: X and Y are pixels from the top-left corner of the plot widget, Y growing downward. The mark stays put on screen. Items are clipped to the axis rect, so a position inside the margins ((10, 10)) shows nothing; start fromx > 60,y > 30.
Marking the crossing
Keep a handle on every primitive you create: assign it to a name, or append it to a list. The item is owned
by Python, so a bare CurvedLine(...) statement is garbage-collected at once and draws nothing.
from SciQLop.user_api.plot import Text, CurvedLine, VerticalLine, LineTermination
from SciQLop.user_api.plot.enums import CoordinateSystem

t_cross = datetime(2015, 10, 16, 13, 5, 45, tzinfo=timezone.utc).timestamp()

# vertical line at the crossing, across the whole height of the B plot
crossing = VerticalLine(b_plot, t_cross, color="#e74c3c", line_width=1.5)
label = Text(b_plot, "magnetopause", x=t_cross + 2, y=35, color="#e74c3c", font_size=11)
panel_letter = Text(b_plot, "(a)", x=70, y=30, coordinate_system=CoordinateSystem.Pixel)

# horizontal reference at the magnetosheath density; value is always in Y data units
sheath = n_plot.add_hline(11.0, color="#3498db")

# curved arrow from the empty magnetospheric side, pointing at the density jump
arrow = CurvedLine(n_plot, start=(t_cross - 15, 8), stop=(t_cross - 0.5, 4),
                   start_direction=(t_cross - 12, 11),
                   color="#e74c3c", line_width=2.0,
                   stop_termination=LineTermination.Arrow)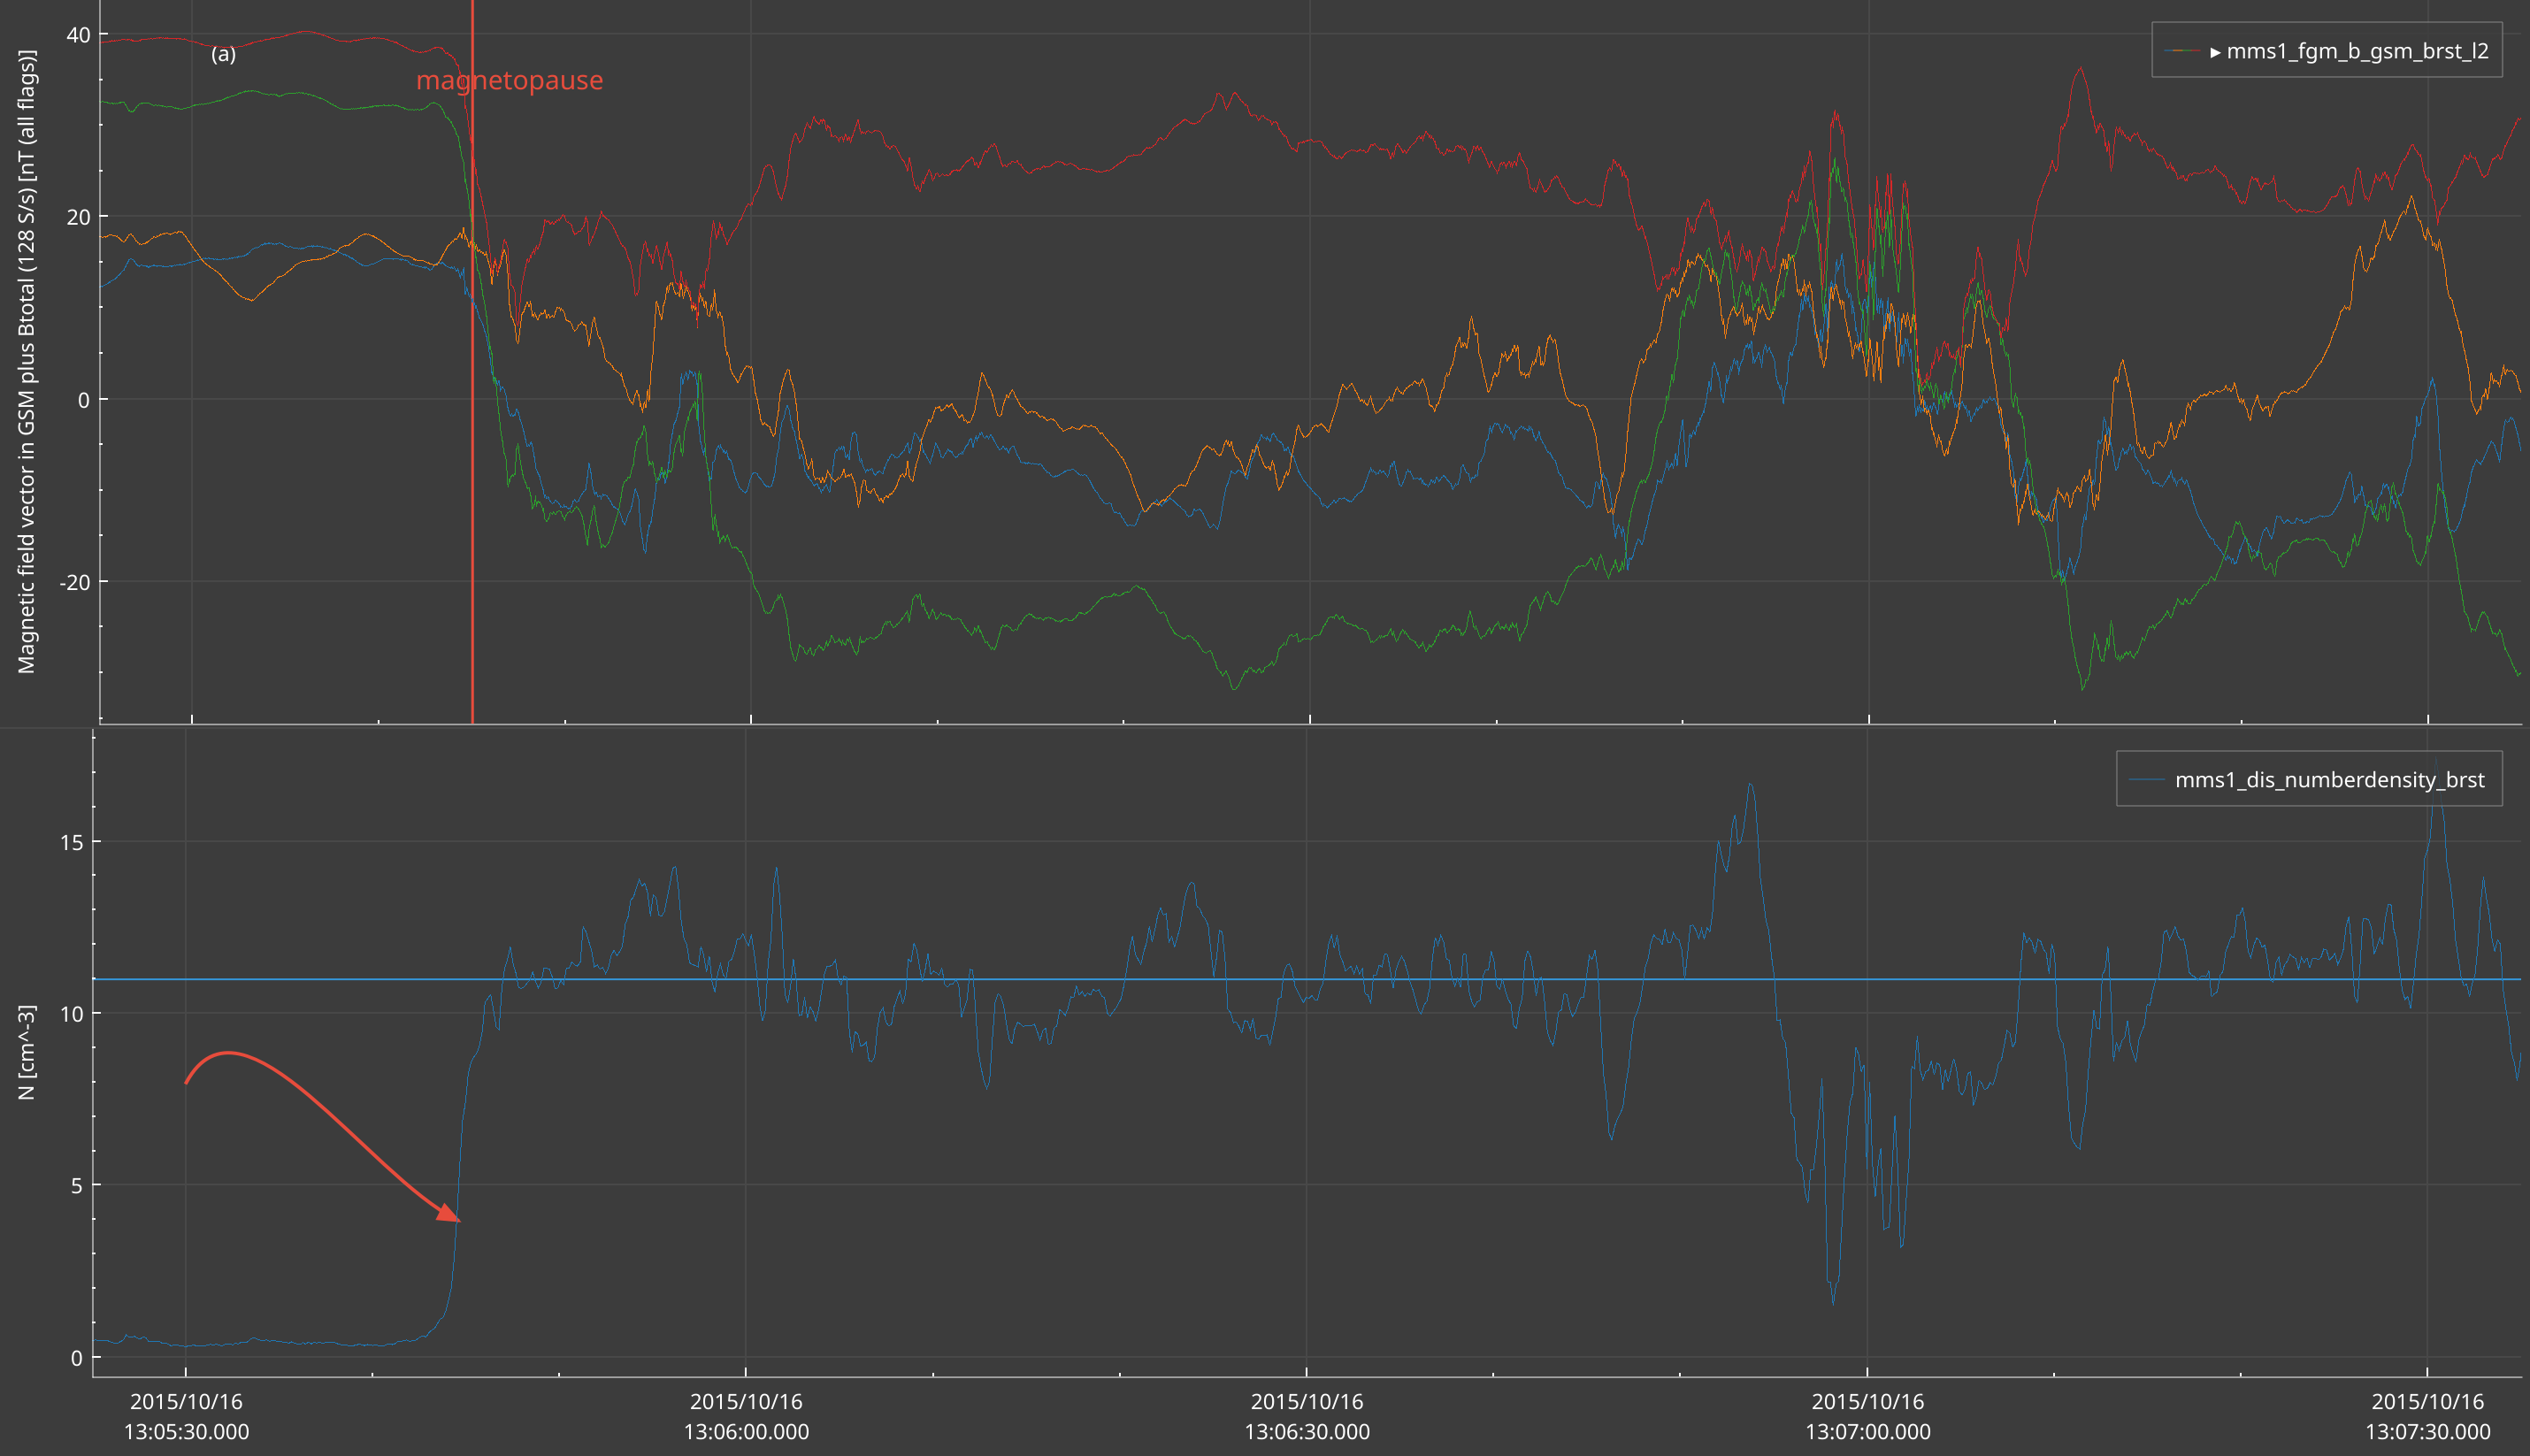
CurvedLine is a Bézier curve. Its two control handles default to the straight segment, so the line is
straight; move start_direction or stop_direction off that segment to bend it. Terminations:
LineTermination.NoneTermination, Arrow, LineArrow, SPikeArrow, Bar, HalfBar, SkewedBar,
Circle, Diamond, Square.
Colours are hex strings, #RRGGBB or #AARRGGBB, or Qt colour names like "red". CSS rgba(...) strings
are not parsed and fail silently. Without a colour, Text, CurvedLine, VerticalLine, StraightLine and
Ellipse take the plot’s text colour, legible on both themes. HorizontalLine is black by default.
Next release
CSS
rgb(...)andrgba(...)work on every primitive, and a colour string SciQLop can’t read raisesValueError.HorizontalLinetakes the theme’s text colour, like the others.
StraightLine(plot, x1, y1, x2, y2) draws an infinite line, but only a horizontal or a vertical one. Give it
two points with the same x for a vertical line, or the same y for a horizontal one.
Shaded bands
HorizontalSpan(plot, y1, y2) shades a band of Y values across the whole plot. RectangularSpan(plot, x1, y1, x2, y2) shades a box. Without a color, they take a semi-transparent version of the plot’s text colour. Pass
#AARRGGBB to choose your own transparency. They are editable with the mouse unless you pass read_only=True.
from SciQLop.user_api.plot import HorizontalSpan, RectangularSpan

sheath_band = HorizontalSpan(n_plot, 8.0, 14.0, color="#403498db", read_only=True)
jump_box = RectangularSpan(n_plot, t_cross - 5, 0.0, t_cross + 5, 12.0,
                           color="#40e74c3c", read_only=True)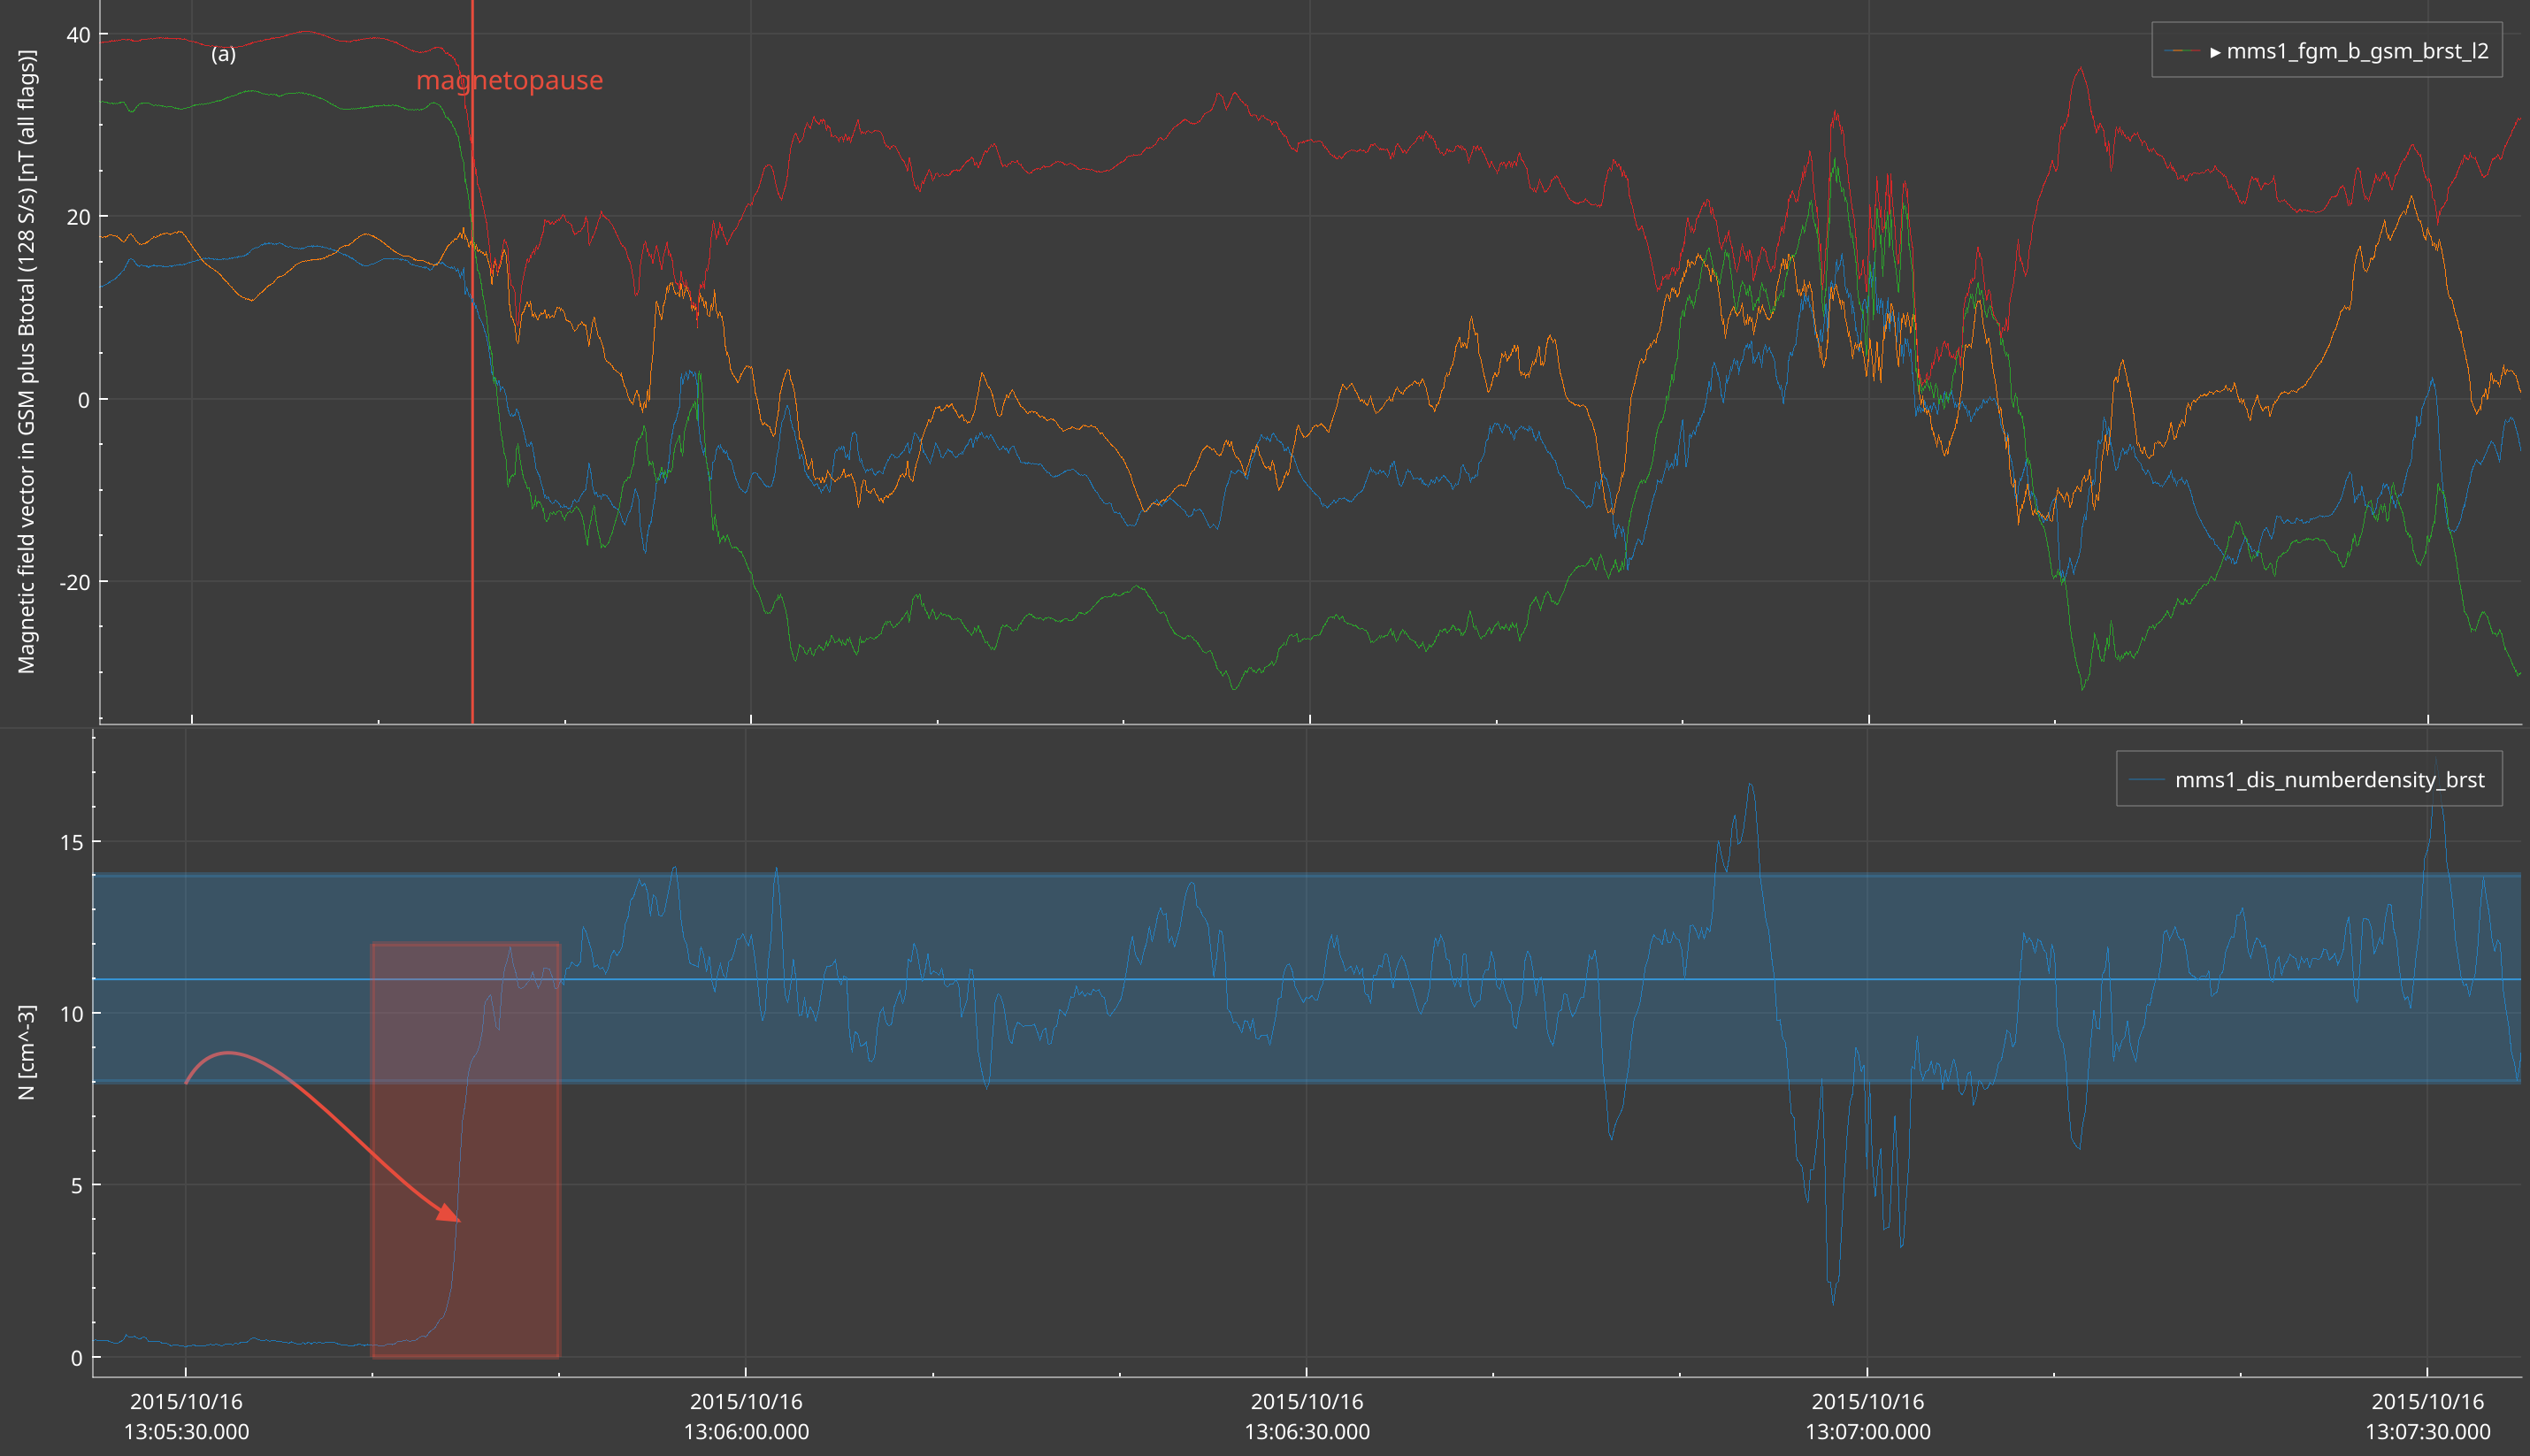
Ellipses and images
Ellipse(plot, x, y, width, height) takes a bounding box in the chosen coordinate system, so on a
time-series plot width is a duration in seconds. Pixmap(plot, x, y, width, height, image) takes a file
path, raw bytes or a QPixmap.
from SciQLop.user_api.plot import Ellipse, Pixmap
from PySide6.QtCore import Qt

t_edr = datetime(2015, 10, 16, 13, 7, 2, tzinfo=timezone.utc).timestamp()   # |B| minimum, the EDR
edr = Ellipse(b_plot, x=t_edr - 3, y=-15, width=6, height=30,
              line_color="#f39c12", line_width=2.0, line_style=Qt.DashLine, fill_color="#40f39c12")
logo = Pixmap(b_plot, x=t_edr + 10, y=20, width=12, height=15, image="/path/to/logo.png")
Updating and removing
Primitives are live objects; set a property and the plot redraws:
label.text = "MP crossing, 13:05:45"
label.position = (t_cross + 2, 28)
arrow.stop = (t_cross - 0.5, 3)
arrow.color = "#c0392b"
sheath.value = 12.0
edr.fill_color = None     # back to transparent
Removing is the flip side of the ownership rule: drop the last reference and the drawing goes away. Every
primitive also has an explicit remove(). All but HorizontalLine have a visible property, to hide one
without removing it. In the next release, HorizontalLine has both.
del arrow
sheath.remove()
edr.visible = False
The bundled notebook 10-SciQLopGraphicPrimitives.ipynb (welcome page) covers the same primitives on another
event.